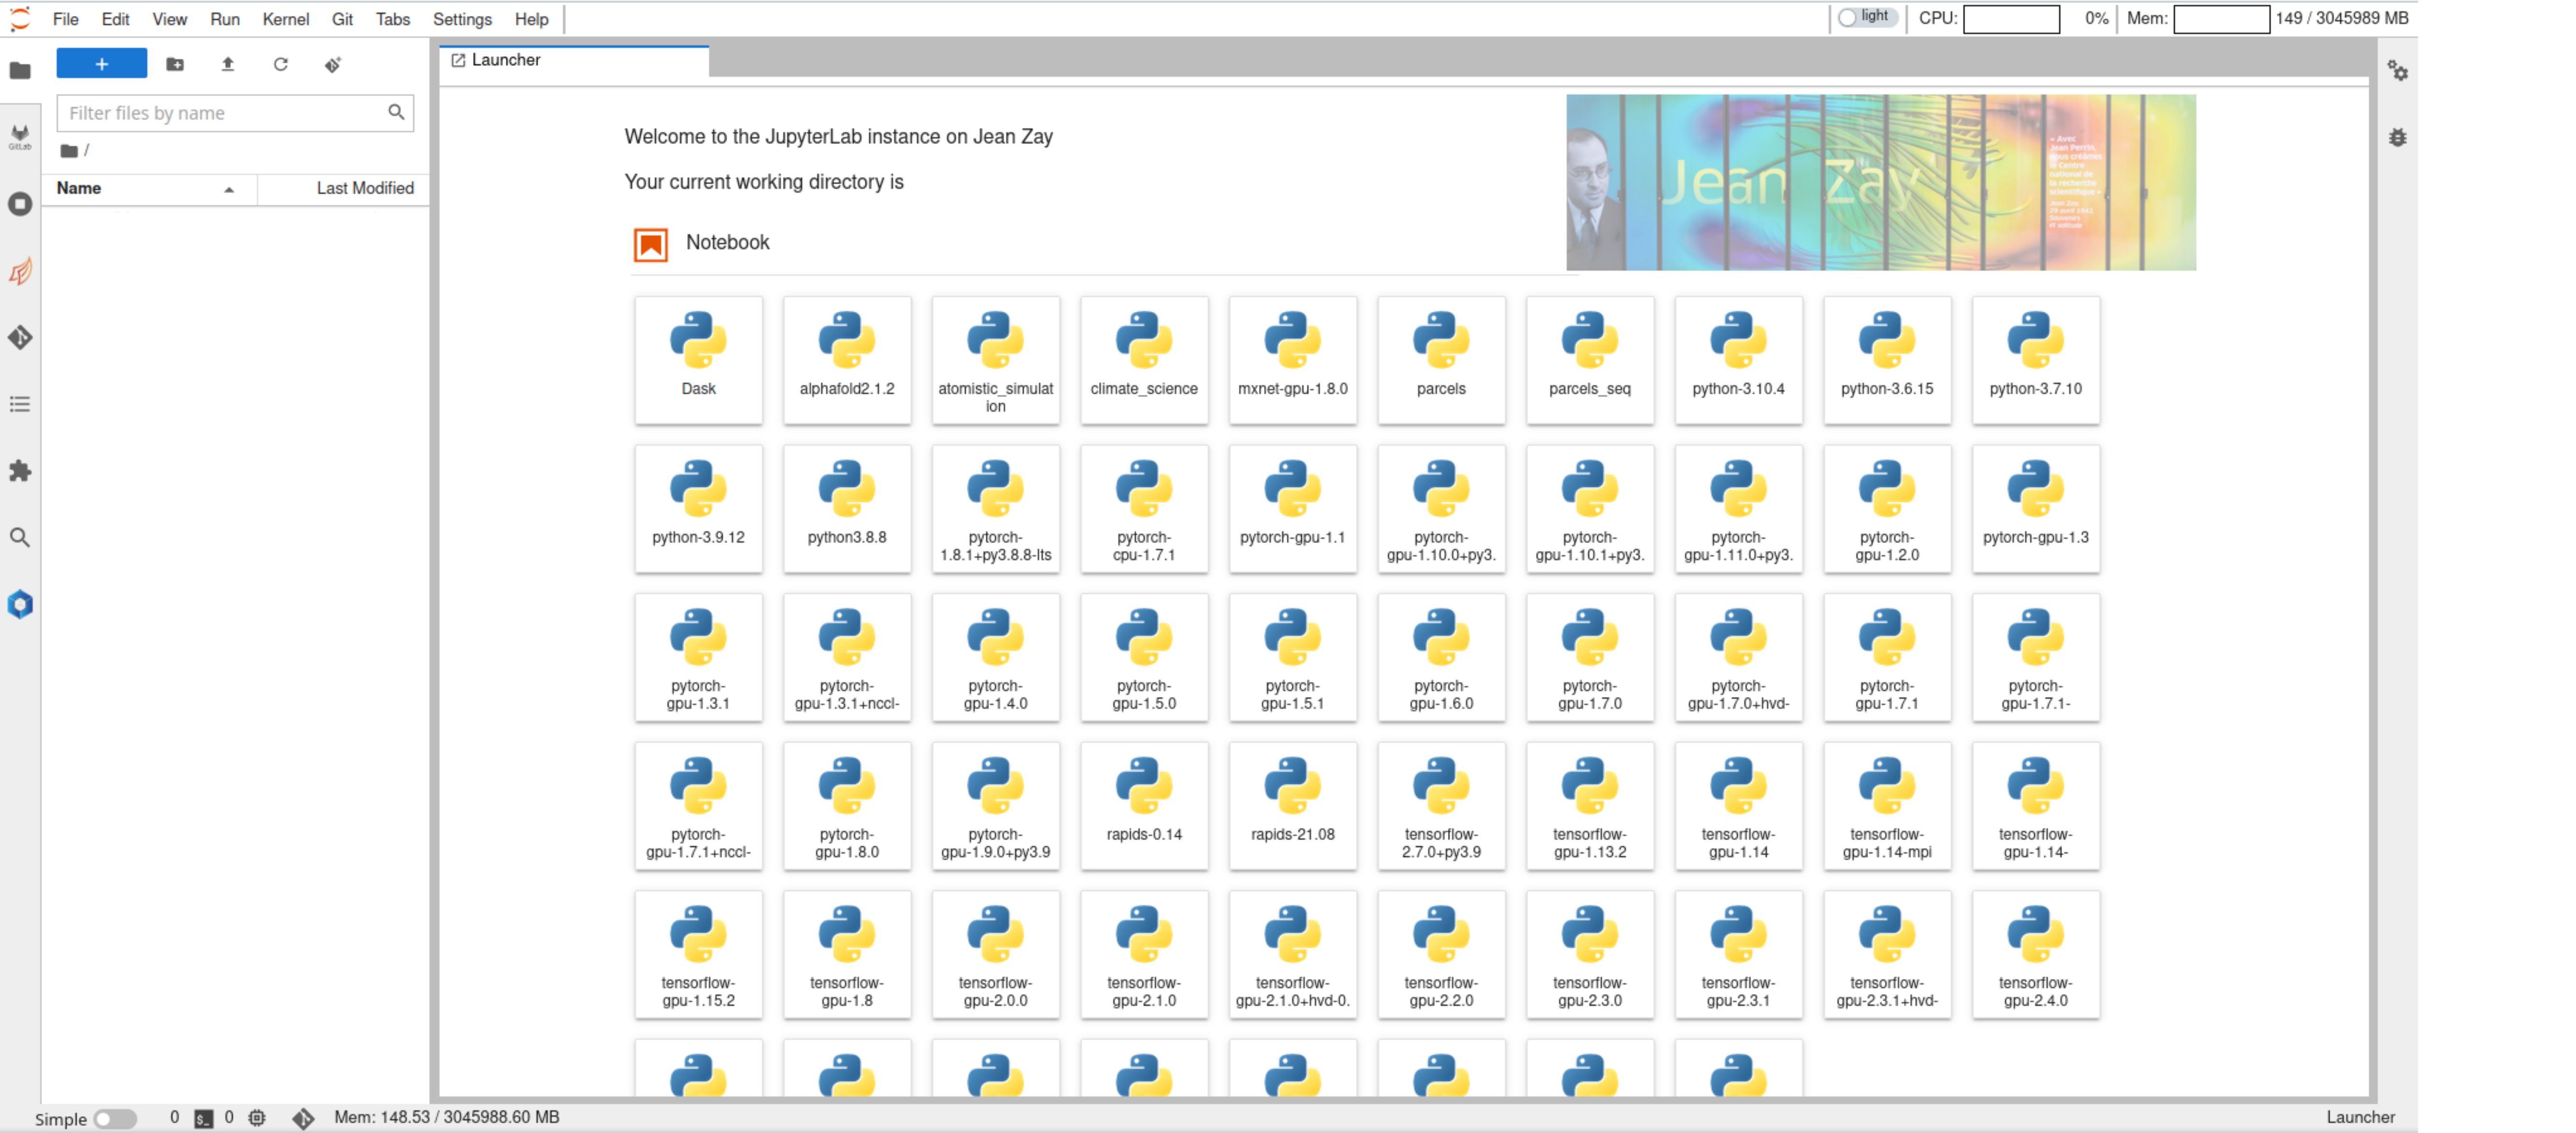
JupyterLab interface
Default launcher page
Users will have the following JupyterLab launcher page upon successful spawning,
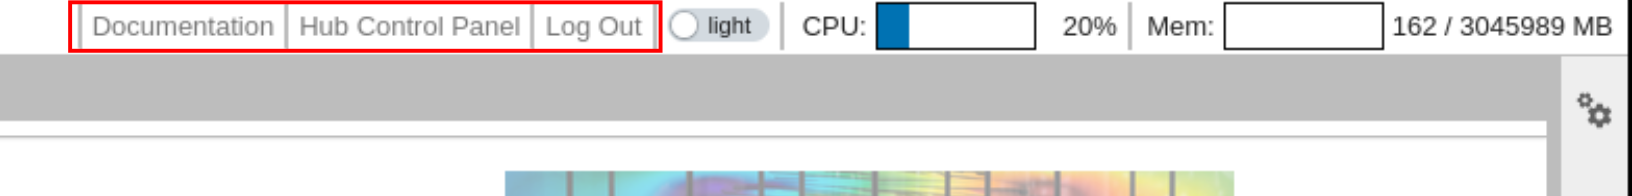
Menu bar
Most of the menu bar items are same as in the classical JupyterLab server except
- Hub Control Panel: go to the page shown in JupyterHub user home to manage the current running JupyterLab instances.
- Log out: This will end the current JupyterHub session and logs out the user.
When the user logs out from JupyterLab instance, it will also stop all the running JupyterLab instances which means all active SLURM jobs will be killed
In order to make these items easily accessible, they are added to the toolbar as well as shown below
Resource usage
On the top right, JupyterLab shows the CPU and memory usage as shown below
![]()
The maximum memory indicated in the component is the memory available for the user in the job. Previously, it used to be total memory available in the node but now it is set to memory available to user. In the case of Interactive Spawner, it is set to 5G which is the maximum amount of memory available to the user. This way users can have a better idea of how much resources they are using.
Power usage and CO2 emissions
Right next to CPU and memory usage, users will find indicator panels that show CPU and GPU, if applicable, power usages as well.
A typical CPU power usage indicator will be displayed as follows:
![]()
If there is no CPU power limit set, only current process's CPU consumption will be shown in the indicator.
The numbers indicate the power consumption of current process / cpu power limit. We estimate the total power consumption using Running Average Power Limit (RAPL) counters that are available on most of the conventional chips. Note that CPU power limit may not be set on all types of nodes. When there is no power limit set, only current process power consumption will be reported.
RAPL counters are estimated based on a software model and they are not measurement at the hardware. So, we should take this power metric values with a grain of salt. Interested readers can look into this study about RAPL counters.
Similarly, GPU power, when user launch a JupyterLab server on a GPU node, will be shown next to CPU power panel.
![]()
If the CPU and/or GPU power usage panels do not appear on the JupyterLab, try reloading the browser. Sometimes the network latencies can stop the extensions to load in time.
Here the number indicate total power consumption of reserved GPUs /
total power limit imposed on GPUs. We get this numbers from nvidia-smi
tool that reports the instantaneous power consumption of each GPU.
As you can see in the above demonstrations, along with CPU and GPU power usages, there is an indicator to show the cumulative equivalent CO2 emissions for the current process. This is estimated from the real time emission factor that gives the grams of CO2 emissions per kWh of power consumed in France.
Real time emissions calculation
The real time emission factor is made available via a public API in France. We leverage this API to get real time emission factor and then use the current power consumption to estimate cumulative CO2 emissions. The emission factor is updated for every 30 min and hence, we update it for every 30 min in the JupyterLab extension as well.
To see how this emission factor evolves during a typical day, you can check rte eCO2 mix data
Launcher categories
Currently, following launcher categories are provided in the JupyterLab instance
- Notebook: Jupyter notebook kernels of different languages like Python, R, C++, Julia, etc., are placed here.
- Applications: Web servers like TensorBoard, MLFlow. etc., can be found in this category.
- Dashboards: Dask and Ray dashboards are integrated into JupyerLab within this category.
- HPC Tools: SLURM job manager is integrated to view, submit and cancel jobs
- Documentation: Documentation links to several softwares and code-bases are provided here.
- Console: Similar to Jupyter notebook except that in code consoles, cells of a code show the order in which code is executed in the kernel, as opposed to the explicit ordering of cells in a notebook document.
- Other: All other applications/kernels like terminal are placed here.
Kernels
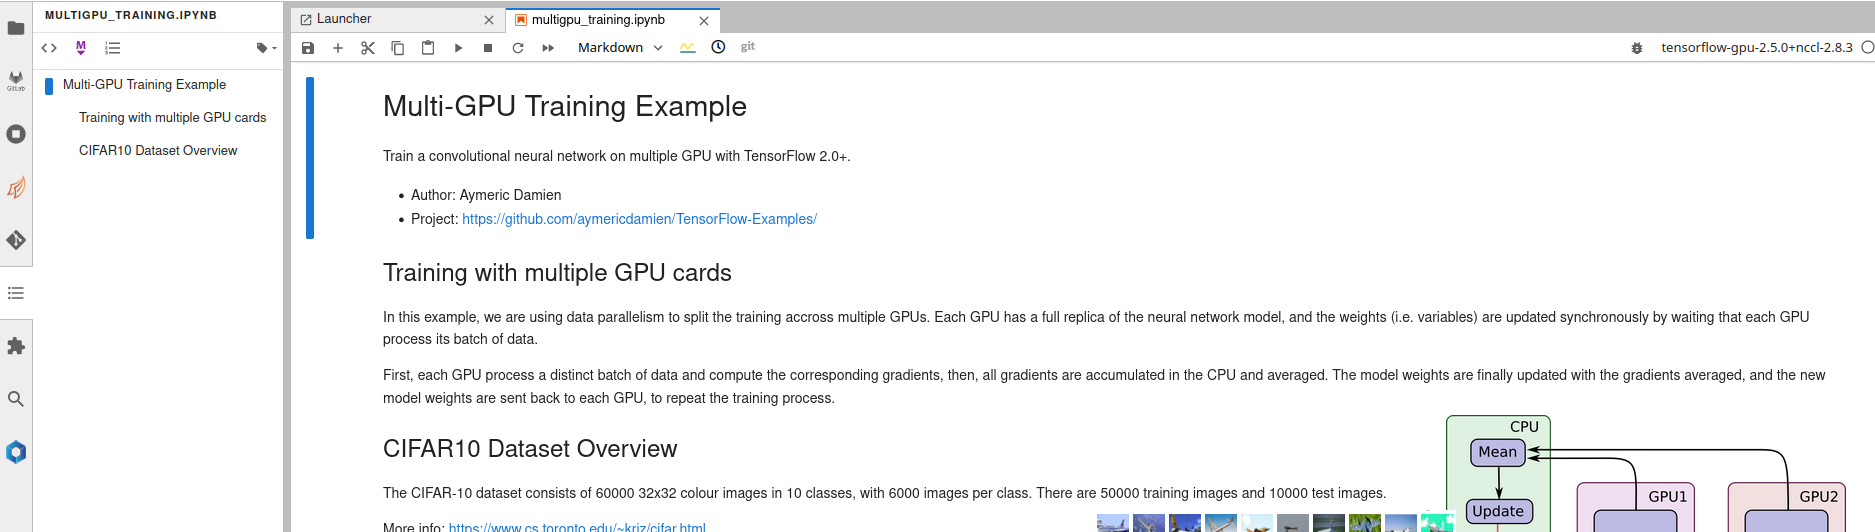
All the existing Python kernels on Jean Zay platform are added to the Notebook category of the launcher. Some of them are shown below,
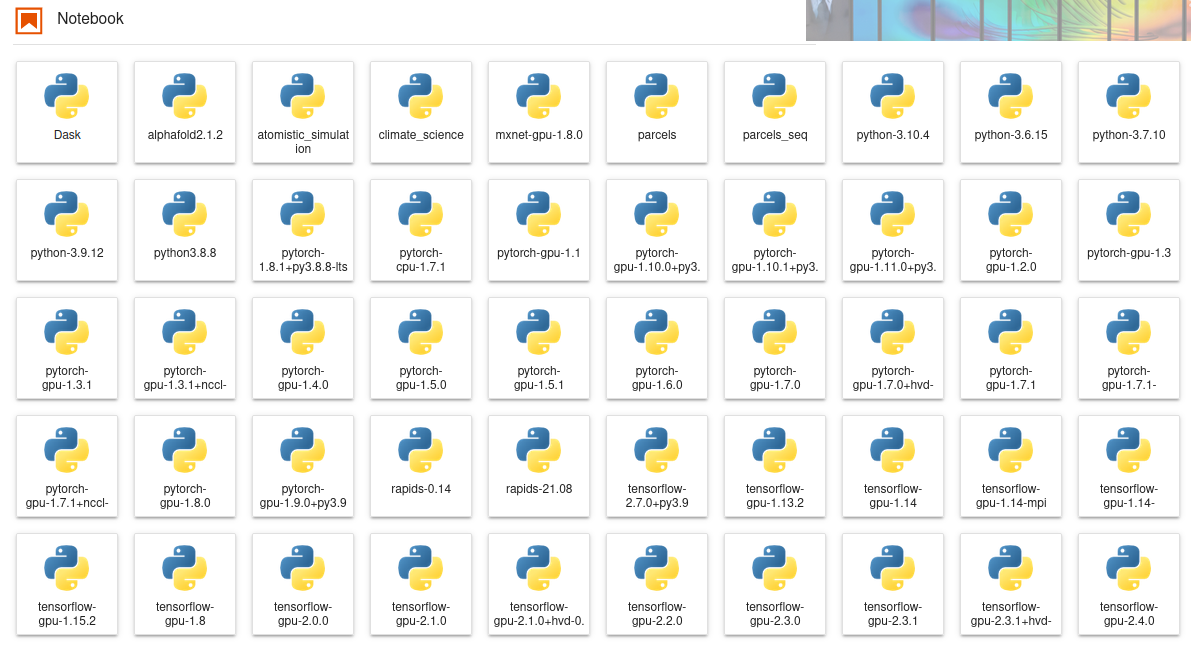
These kernels can be used directly without user having to load any environment modules. In fact, all the necessary modules are loaded before launching the kernel and this is done completely transparent. Launching any of these kernels will go through following steps:
- Clean up existing environment
- Load necessary modules to be able to use that kernel
- Launch the ipython kernel
Therefore users can work with multiple notebooks that use multiple kernels at the same time without any interference among them.
In the past, a specific script setup-user-kernels is executed to find
all the kernels that are available in the environment modules of Jean
Zay. This has been replaced by a new mechanism inspired by
nb_conda_kernels
to discover all the kernels available in the environment modules. The
kernel discovery process happens in the real time while users are using
their JupyterLab servers. The discovery results are cached for a certain
period to avoid polling for kernels repeatedly. In simple words, if the
admins of Jean Zay add a new kernel in one of the existing environment
module or even add a new module altogether with a kernel, that kernel
will pop up in the user's JupyterLab server with a maximum delay of
cache TTL (which is 15 min).
The difference with the previous approach is that users have to run the
script setup-user-kernels -f manually to add the newly added kernels
on Jean Zay platform to their lab servers. Now this will be done
automatically and transparently for the user.
Consequently the option Update notebook kernels in the spawner form
has been removed.
User kernels
Users might want to use their own environments and hence their own
kernels in their workflows. This section shows how can users can add
their custom kernels installed by conda to the JupyterLab launcher. All
user related kernels must be placed in
$HOME/.ipython/kernels folder. First create a new folder
for placing kernel related files
Previously, custom kernels could be installed at $HOME/.local/share/jupyter/kernels.
Following few security related configuration changes, installing kernels at this path
might not work. The recommended installation location for custom kernels now is
$HOME/.ipython/kernels.
However, for VS Code users, kernels must still be placed in the $HOME/.local/share/jupyter/kernels/ folder.
mkdir -p $HOME/.ipython/kernels/mycustomkernel
We assume that users already have an existing conda installation. Instructions on how to install conda and is out of the scope of current documentation. Create new conda environment and install ipykernel
${CONDA_PREFIX}/bin/conda create -n testenv -y python=3.8 ipykernel
assuming CONDA_PREFIX variable contains path to conda installation
Following create a kernel script with following contents
echo '#!/bin/bash

module purge # disable the external environment

# Activate your Python virtual environment
source ${CONDA_PREFIX}/etc/profile.d/conda.sh
${CONDA_PREFIX}/bin/conda activate testenv

# Ensure python packages installed in conda are always preferred
export PYTHONPATH=${CONDA_PREFIX}/lib/python3.8/site-packages:${PYTHONPATH}

exec python -m ipykernel $@' > $HOME/.ipython/kernels/mycustomkernel/kernel.sh

# Make it executable
chmod +x $HOME/.ipython/kernels/mycustomkernel/kernel.sh

# Copy contents of kernel folder in environment
cp -r ${CONDA_PREFIX}/envs/testenv/share/jupyter/kernels/python3/* $HOME/.ipython/kernels/mycustomkernel/
Finally, we need to modify the contents of kernel.json as follows
echo '{
"argv": [
 "'"$HOME"'/.ipython/kernels/mycustomkernel/kernel.sh",
 "-f",
 "{connection_file}"
],
"display_name": "My Custom Kernel",
"language": "python",
"metadata": {
"debugger": true
 }
}' > $HOME/.ipython/kernels/mycustomkernel/kernel.json
Now refreshing the JupyterLab session in the browser will pick this new kernel and user would be able to use it within the session.
Extensions
In order to get list of installed JupyterLab extensions open the launcher, start a terminal and run command
jupyter labextension list
Some of the extensions installed on the JupyterLab instances are:
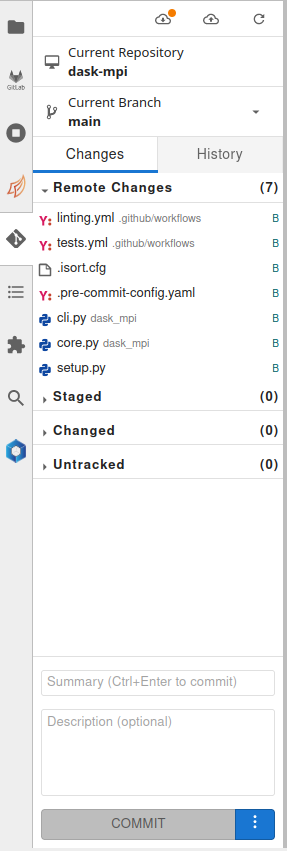
Git
This extension lets users to manage git repositories from JupyterLab interface.
Environment modules
This extension can be used to load environment modules on Jean Zay platform via JupyterLab. To launch certain applications like TensorBoard, MLFlow users need to load an appropriate module using this extension before launching the application. If the user loads a module after launching kernel, the kernel needs to be restarted to be able to use the module.
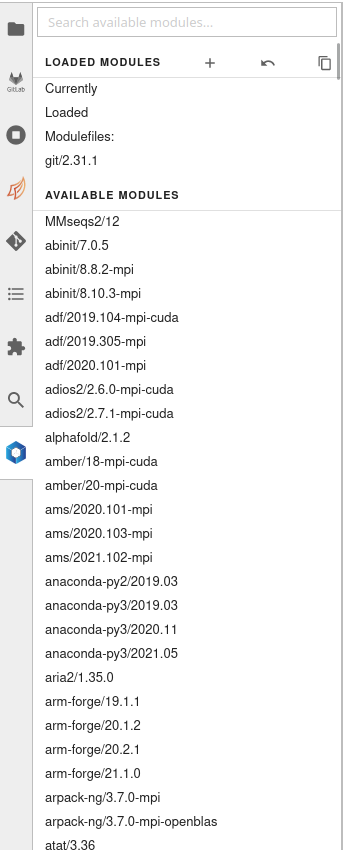
Table of contents
A Table of Contents extension for JupyterLab. This auto-generates a table of contents in the left area when you have a notebook or markdown document open.The entries are clickable, and scroll the document to the heading in question.
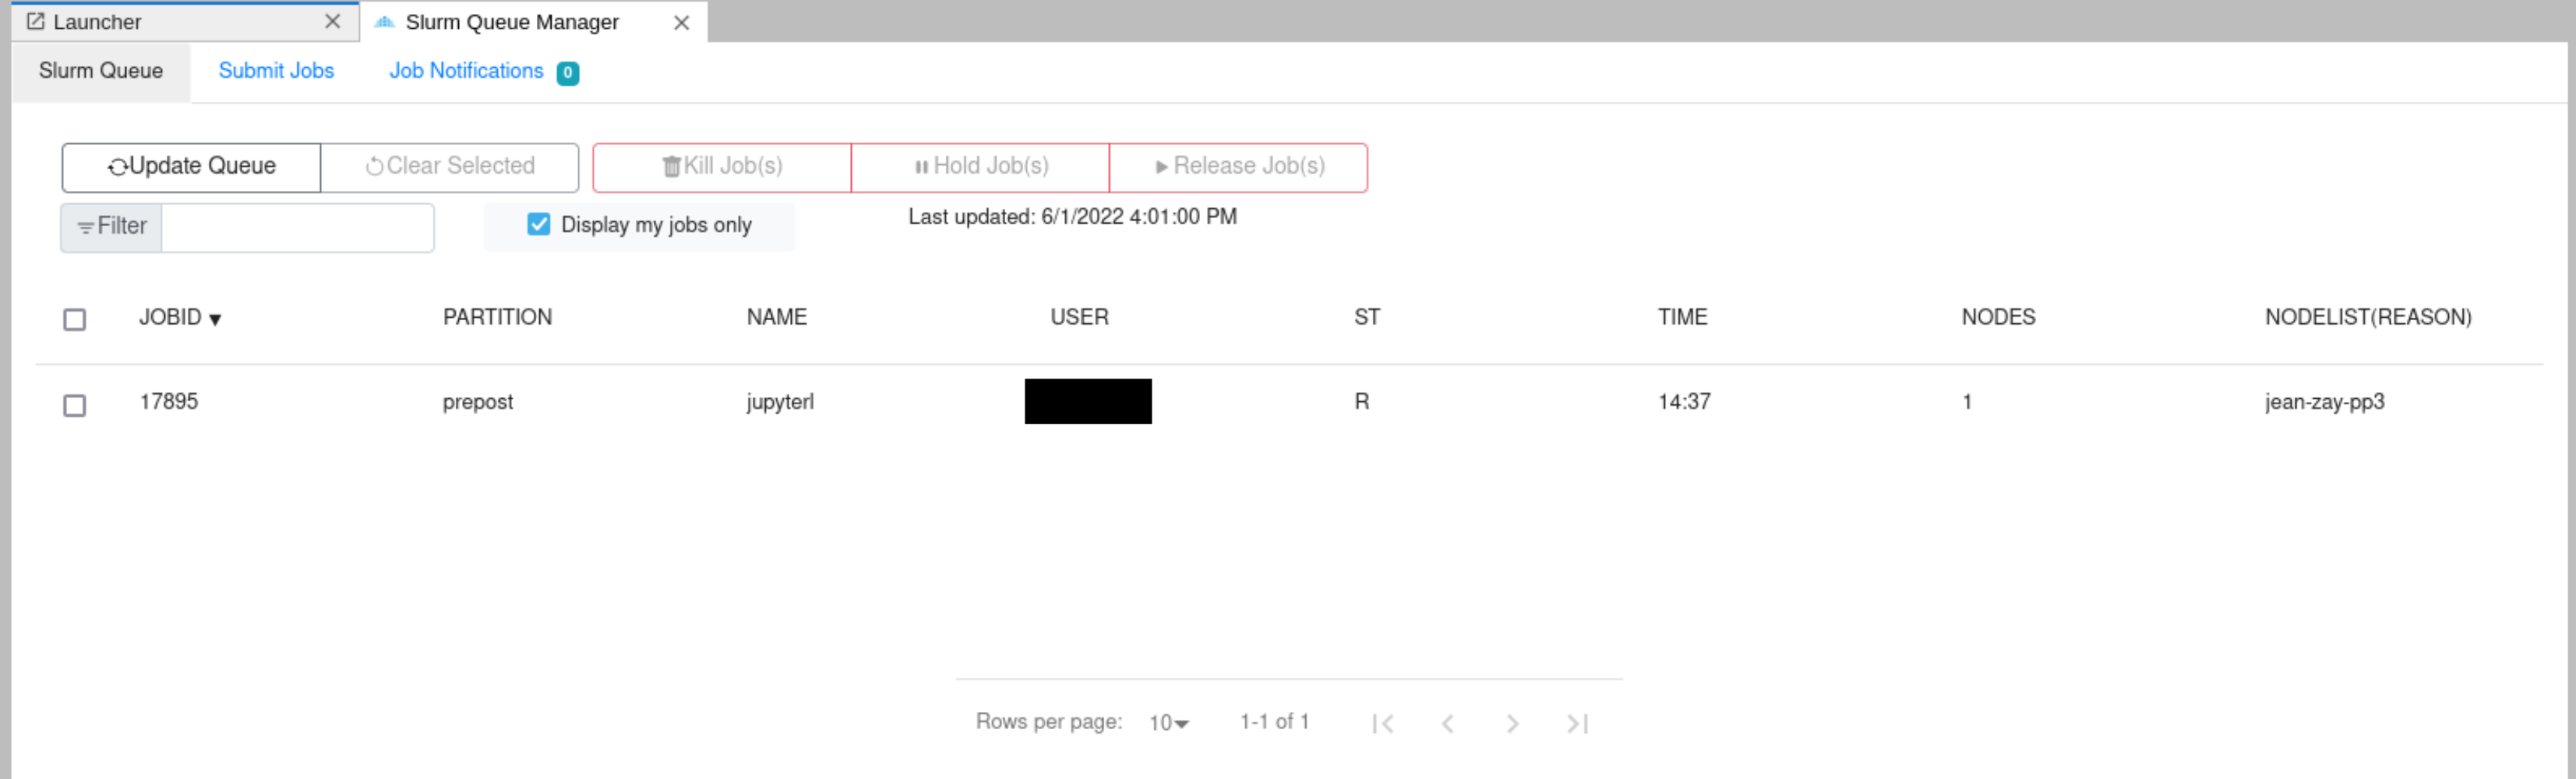
Slurm job manager
A SLURM job manager extension for JupyterLab. The user will be able to consult the list of running jobs, cancel the user jobs and submit new jobs from the JupyterLab launcher. More details can be obtained from Documentation.
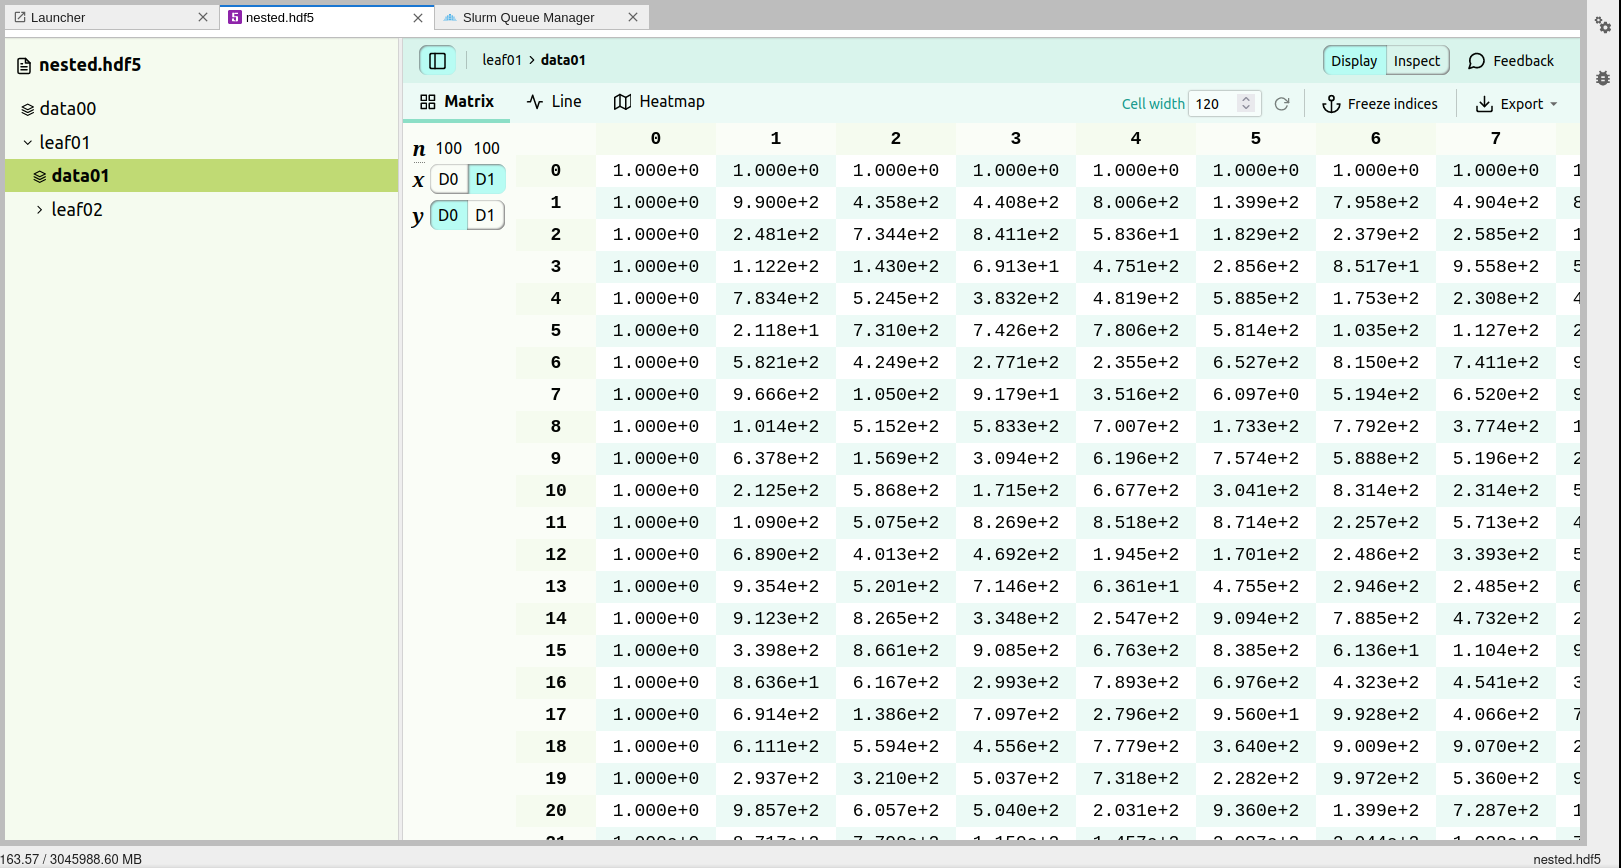
HDF5 viewer
An extension for HDF5 is included which enables the users to open HDF5 files and inspect the content, visualise them, etc. More details on how to use the extension can be consulted from Documentation.
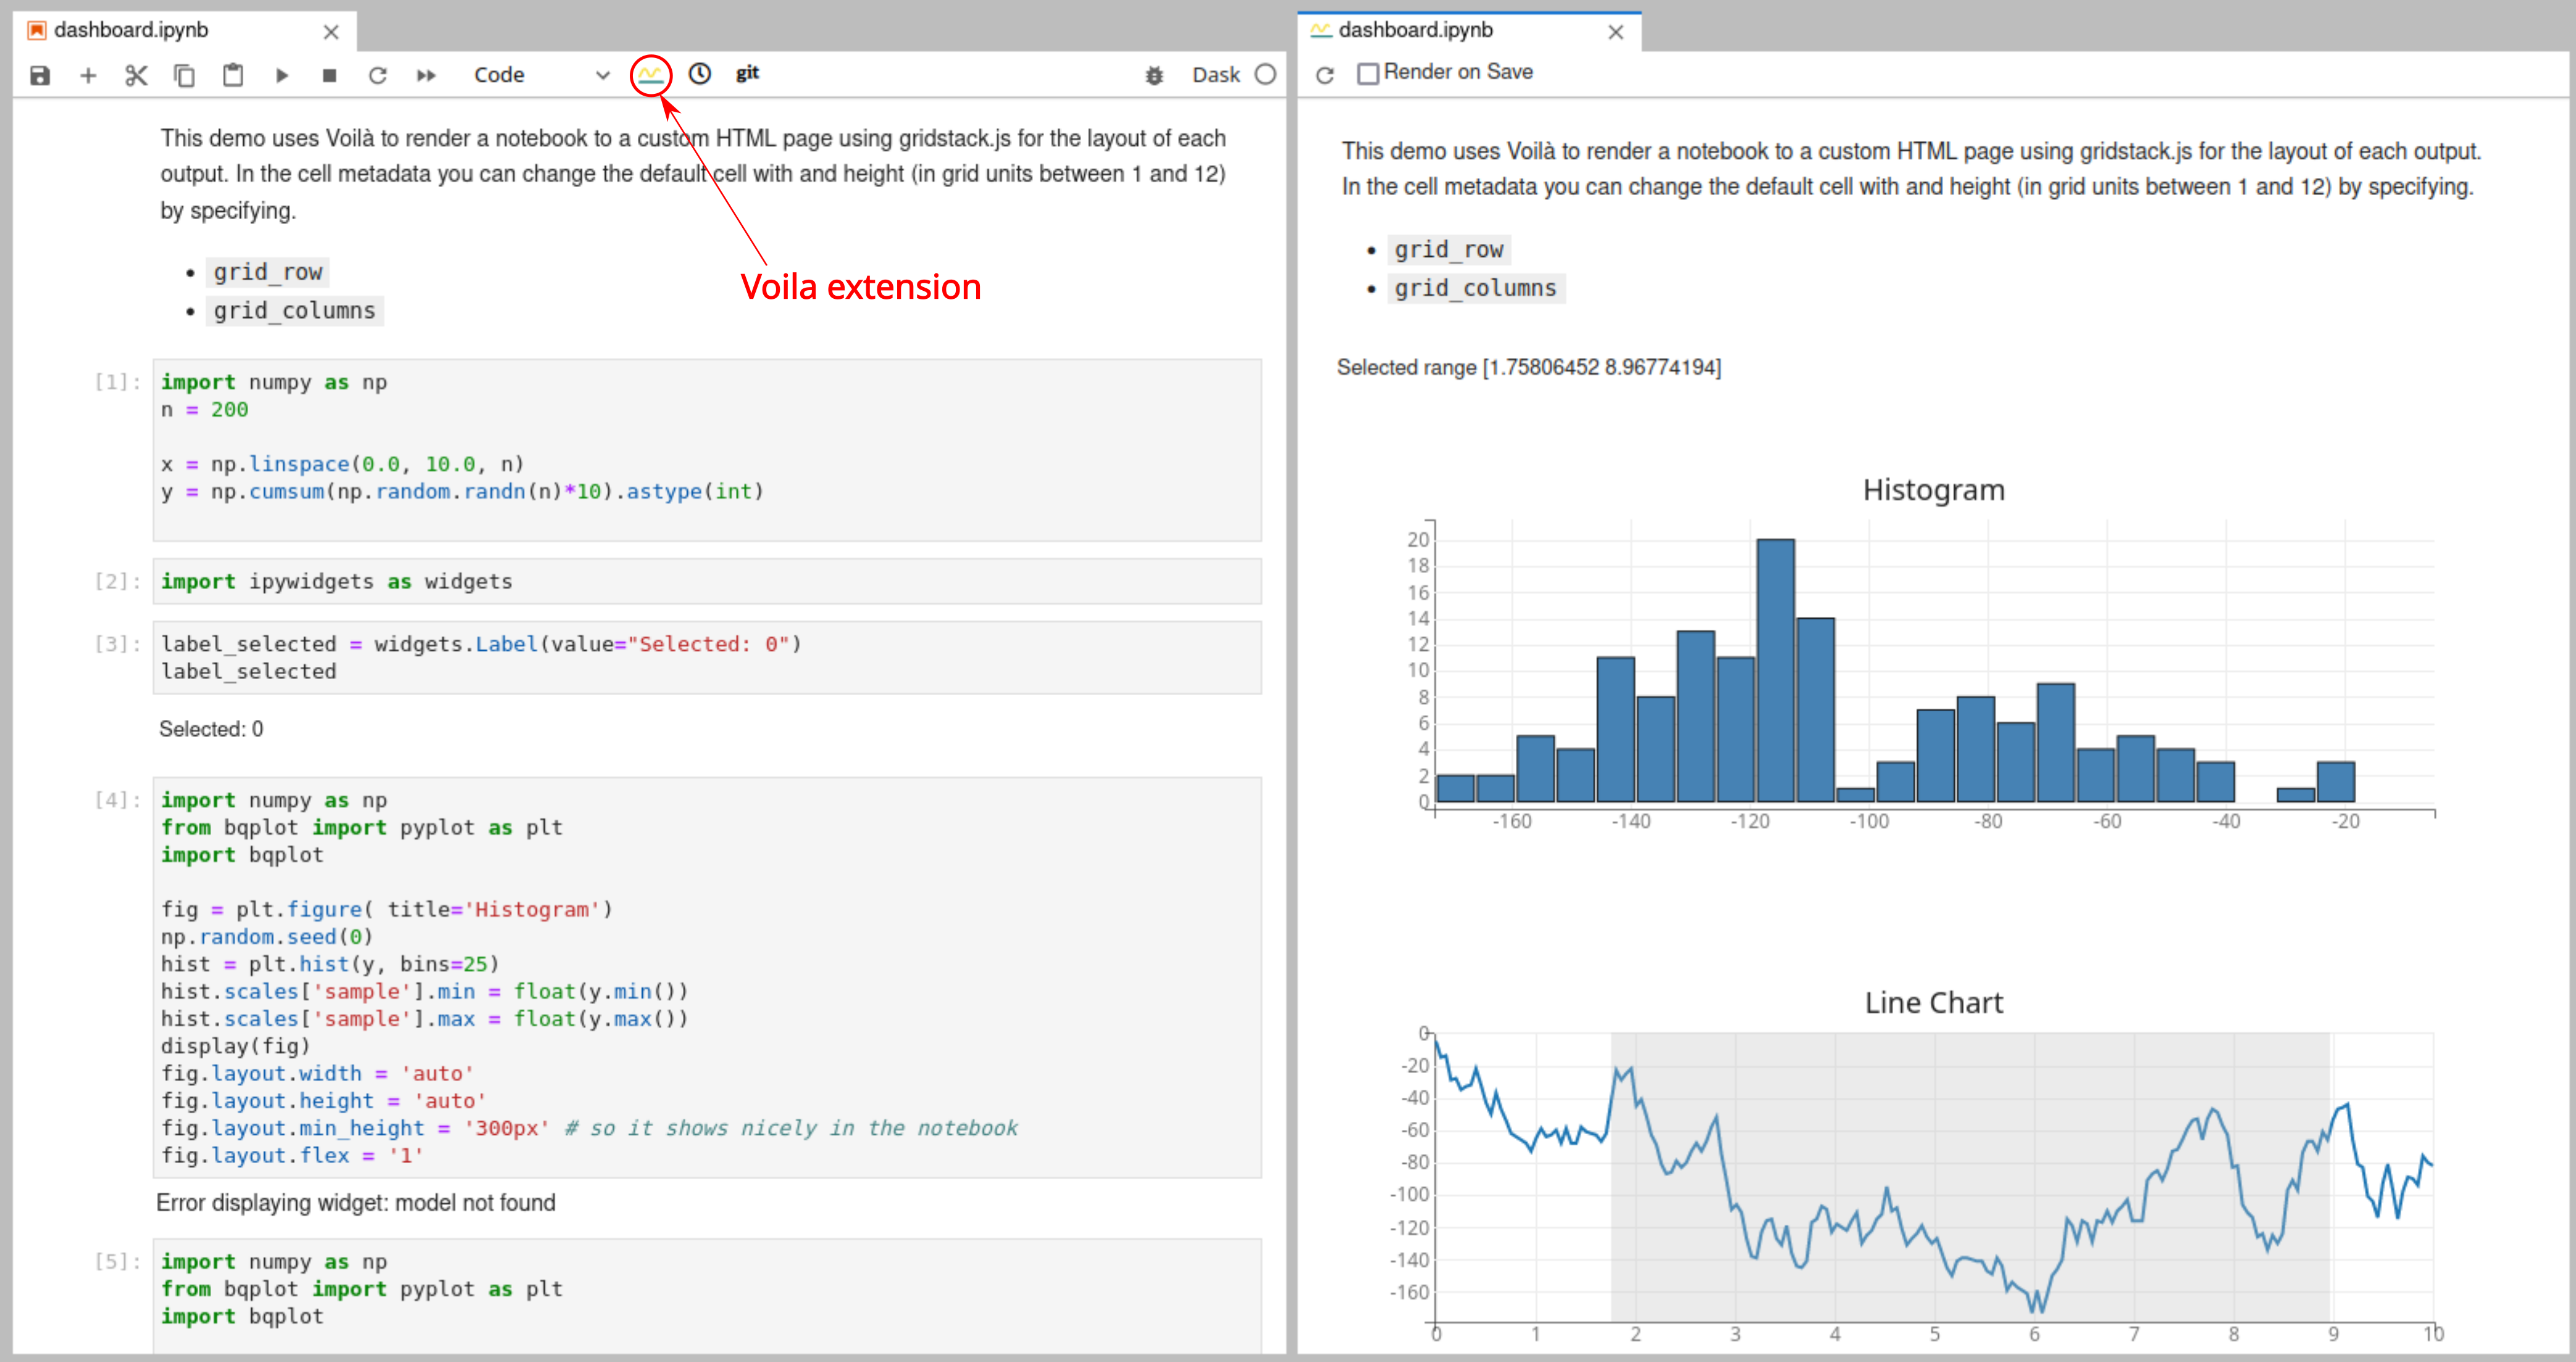
Voila
Voila turns Jupyter notebooks into standalone web applications. More details can be found at Voila documentation. Voila needs to be installed in the kernel environment to be able to use it.
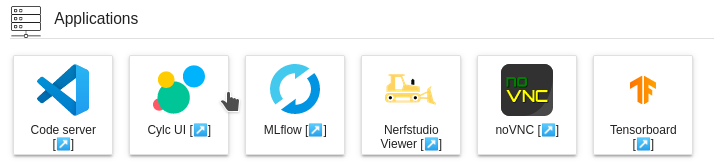
Applications
JupyterLab has a very convenient extension called jupyter-server-proxy which lets users to run arbitrary external processes alongside notebook and provide authenticated web access to them. Thus web servers like TensorBoard, MLFlow, etc., can be authenticated and proxied via JupyterLab. Currently, following set of applications are provided on the JupyterLab instance.
Users need to load appropriate module files before launching these applications. For instance, in order to use TensorBoard, one of the module files that has TensorBoard installed must be loaded before launching the application.
Paths are resolved relative to the root directory in the filebrowser.
For instance if user launched JupyterLab instance using $WORK as root
directory, then setting mytblogs as --logdir for tensorboard, it
means the absolute path of --logdir will be $WORK/mytblogs.
Once the icon is clicked in the launcher, an input dialog will pop up to configure command line arguments and environment variables that are necessary to launch the application
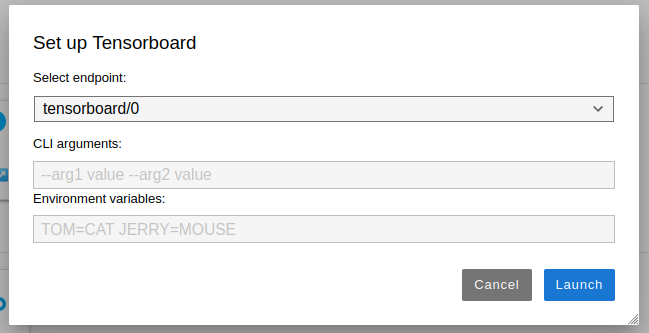
Shell expansion is supported for both command line arguments and environment variables in the input dialog while launching applications.
All the applications, except Code server, can run at 3 different
endpoints within the same JupyterLab session. User can toggle between
different endpoints using Select endpoint dropdown.
Previously, these endpoints used to be referred as "Instances" and we have changed it as endpoints is a more appropriate name.
Upon clicking launch, jupyter server proxy will launch the application and proxy the endpoints of application via JupyterLab and opens a new tab where user can access the application.
If the user encounters any errors while launching an application, the exact error will be displayed in the error page. If no error is shown or if the displayed error is not meaningful, the user is advised to check the JupyterLab logs to find out the point of failure.
If the user wants to shut down already running applications (for example, to relaunch them with different CLI arguments), they can do so via the toolbar on the left as shown in the figure
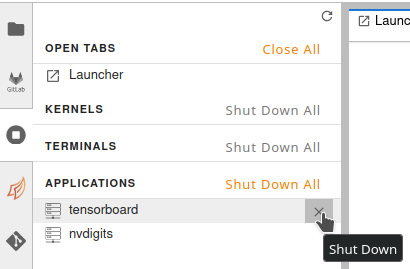
It is important to close the browser window where the application is running before shutting it down. If the tab is kept open, jupyter server proxy might try to relaunch the application as soon as user shuts it down.
Tensorboard server
Users need to set --logdir CLI argument for launching tensorboard
server. If the server is launched without this argument, user will
probably get 500 HTTP code saying Internal server error. The errors are
logged in logs which can be consulted at $WORK/jupyter_spawner_logs.
When using tensorboard application to analyze huge log files, make sure the user configure the SLURM job with enough memory. If tensorboard backend runs out of memory, it tends to fail silently without spitting out any errors.
MLFlow server
MLFlow server needs to be launched in the root directory that contains
mlruns directory. It seems like there is no CLI argument to configure
this directory for the MLFlow server. So, we are providing an
environment variable MLRUNS_DIR that points to the directory where
mlruns exist. This has to be parent directory of mlruns directory.
For example, if the experiments are located at $WORK/mlflow/mlruns
then users need to set MLRUNS_DIR=$WORK/mlflow.
The environment variable can be set at least in two different places.
- In the Environment Variables section of the input dialog that will be shown when launching the MLFlow server.
- In the Environment Variables input box in the JupyterHub spawner options.
The value set in the input dialog before launching MLFlow server takes precendence over the value set in the Spawner form, i.e., the most recently set value is read.
If MLRUNS_DIR is not set, mlflow server will be launched in the HOME
directory of the user.
Nerf Studio Viewer
Nerfstudio Viewer enables users to view the training in the real time. In order to use the Nerfstudio viewer, users need to launch the viewer application on the same node where the training is launched. One obvious way is to launch the training on one of the GPU nodes via JupyterLab instance. Users can spawn a JupyterLab instance on GPU nodes using SLURM spawner and then once the training has started, launch the Nerf Studio Viewer application. There is no need to configure any CLI args/Environment variables on the input prompt.
The important thing that users need to configure is the websocket_url.
Imagine user foo launched a JupyterLab instance named
jupyterlab_nerf, then the URL in the browser when accessing JupyterLab
will be https://jupyterhub.idris.fr/user/foo/jupyterlab_nerf/lab. Now,
say the viewer is running on the port 7007, then the proxied
websocket_url would be
wss://jupyterhub.idris.fr/user/foo/jupyterlab_nerf/proxy/7007/. Thus,
user can access the viewer at
https://jupyterhub.idris.fr/user/foo/jupyterlab_nerf/nerfstudio/0/?websocket_url=wss://jupyterhub.idris.fr/user/foo/jupyterlab_nerf/proxy/7007/
Note that the scheme in proxied URL is wss and not ws. The native
viewer run by nerfstudio does not have TLS enabled, but when we proxy
the app via JupyterLab, TLS is enabled and hence, wss.
noVNC
Users can access the remote desktop using noVNC application. Like code server, only a single endpoint is allowed for noVNC.
Users need to launch the JupyterLab instance on a visu partition to be
able to use noVNC. If users get an error message like
/opt/TurboVNC/bin/vncserver and/or /opt/TurboVNC/bin/vncpasswd executable(s) not found
that means the users are attempting to launch noVNC from nodes other
than the ones in the visu partition.
Terminal in the noVNC desktop does not open in the user's home directory. Users first need to change to their home before creating or accessing existing files.
Upon launching noVNC server, user is supposed to land within an
authenticated session. If this is not the case and the users can
authenticate themselves with password that can be retrieved from
$HOME/.vnc/idris_config file.
Sandbox mode
Imagine a situation where user A has launched a tensorboard server on a
shared node like prepost, compil, etc. Tensorboard does not offer
any internal authentication flow and thus, in theory, any user who is on
the same node, say user B, can eavesdrop on the tensorboard server of
user A. Although supplementary checks have been implemented in the
current JupyterLab deployment, a skilled user can always circumvent
these constraints. Even if the user A is using a compute node in
exclusive mode, it is still possible to access the web servers without
authentication flow that are listening on all interfaces for other users
who are in the Jean Zay network. However, user's Jupyterlab instances
are immune to this as each instance has in-build authentication
implemented.
This limitation is only applicable for the web applications like Tensorboard or any others that you can access via browsers. This does not apply for your training jobs or workflows based on MPI as sniffing MPI comms on TCP ports need much more sophisticated attacks and packet sniffing is not possible without privileges.
This is where linux namespaces comes into the game. More precisely, we are interested in the network namespace. Creating a network namespace and launching web servers inside this namespace will make these web applications unreachable from the host. Most of the container technologies like Docker, Podman use the linux network namespaces to create container specific networks. Unfortunately, it is not possible to create sandboxed networks with Singularity containers without privileges.
When user chooses to launch JupyterLab in the sandbox mode, following steps happen:
- First a network namespace is created.
- JupyterLab instance will be started inside the network namespace.
- A routing rule will be added to route requests on the host network to the JupyterLab inside the sandbox. Without this step, the users will be never be able to connect to their JupyterLab instances. All other web applications like MLFlow, Tensorboard, etc., will stay inside the sandbox completely isolated from the host network.
Of course, as with any solution, this has some strong limitations as well:
- This will not work in multi node environment. If a user makes reservation of more than one node and launches a distributed training job within a notebook using MPI/NCCL backends, the slaves processes that are running on different nodes will not be able to connect to the master, as master is running within a sandbox and unreachable for the world.
- Setuid binaries will not work. Hence, certain tools like
idracct,idrcontmgrwill not work.
Sandbox mode is ideal for the users who wish to postprocess their results in an isolated environment. Running in the sandbox mode does not mean that your data is completely safe. In-compute data is never safe in the current HPC environment but, highly sophiscated attacks need to be carried out to comprise the data which is highly improbable.
When users launch servers in sandbox mode, there will be a small increase in the startup of the server as there are few pretasks that need to be executed before launching server instances.
When user launches a server instance in sandbox mode, in the case of JupyterLab, a top bar message will as shown below will be added to indicate the user that the server is in sand box mode.
![]()
Similarly, in the JupyterHub home page, that server that is running in sandbox mode will be displayed as follows:
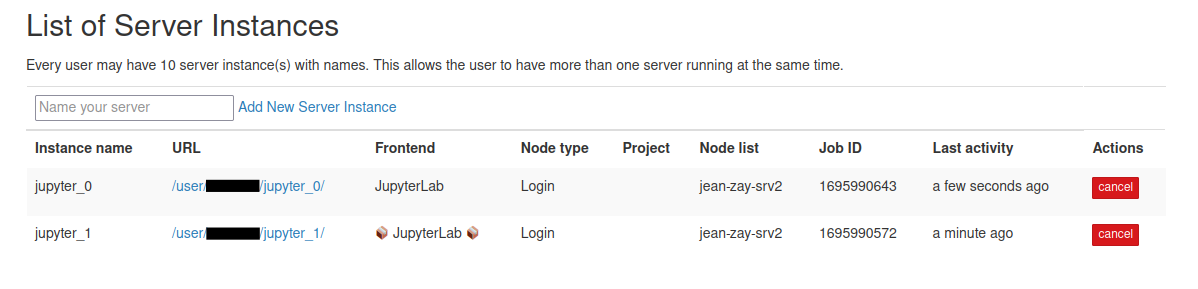
In the above server list, "📦 JupyterLab 📦" is running in sandbox mode while the other one not.
File system view
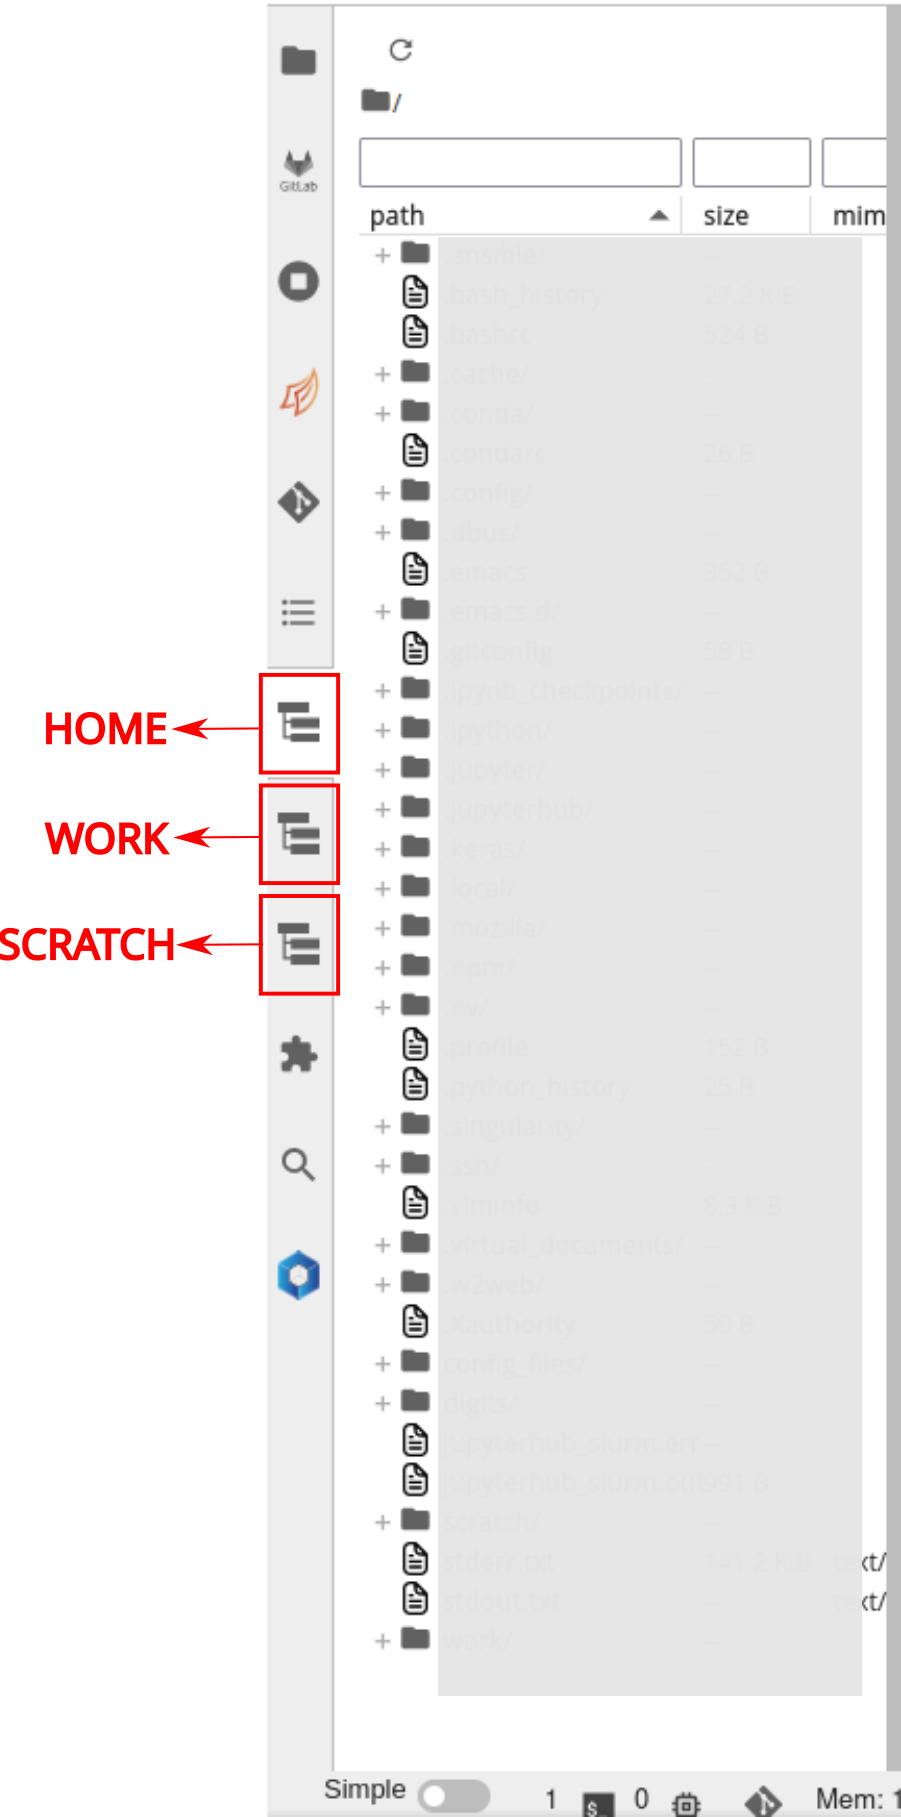
JupyterLab file explorer has a limitation of not being able to go above
the root folder where Lab instance is started, i.e., if the user sets
the NotebookDir to WORK, it is not possible to access HOME or
SCRATCH in the file explorer unless user has created soft links to
those respective directories. To address this limitation, a file system
extension called
jupyter-fs is added to
the JupyterLab instance.
If there are any broken symlinks in the root directories of HOME, WORK
or SCRATCH, these file explorers will fail to load. Always ensure to fix
any broken symlinks.
Users can add different file systems to the JupyterLab and browse
through them seamlessly. By default, all users have their HOME, WORK
and SCRATCH of default projects configured.
If the users wish to add more file systems, for instance, WORK
directory from different projects, they can do so using Jupyter server
configuration from JupyterLab UI. Users need to navigate to
Settings -> Advanced Settings Editor. Then choosing jupyter-fs from
sidebar will show following page
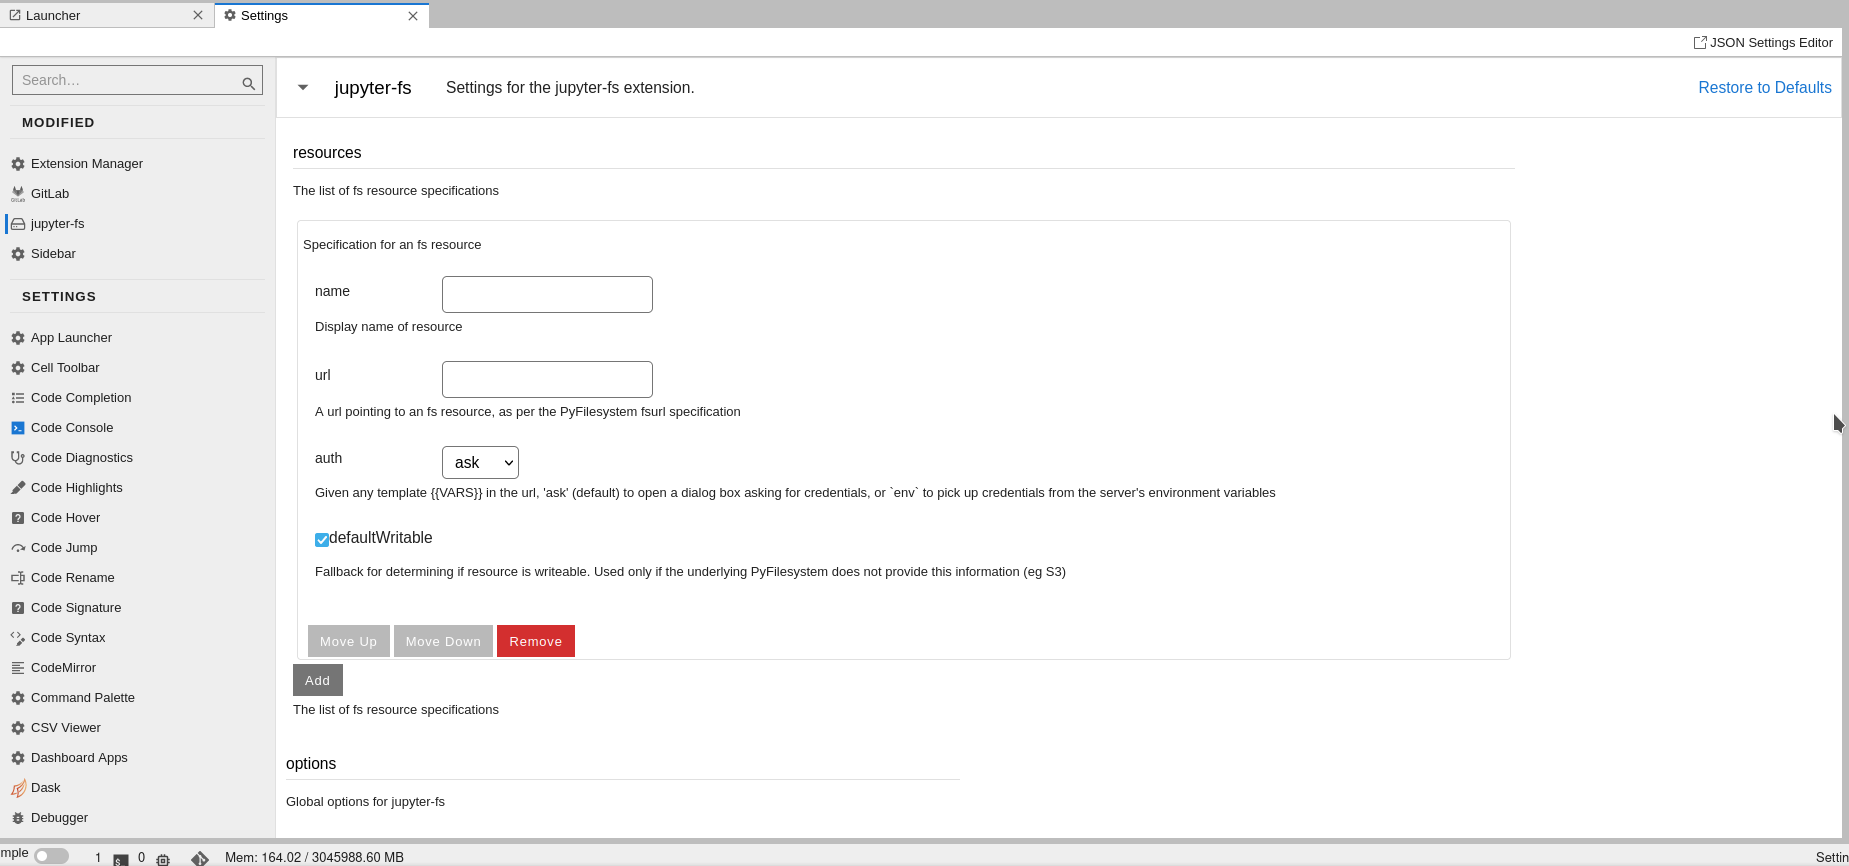
In the name field, users can give name to the file system like
myproject WORK and URL should be of form
osfs://<path_to_file_system>. For example, if user wants to add file
system /gpfswork/rech/project/user directory, then URL should be
osfs:///gpfswork/rech/project/user. The field auth in the form can
be ignored and use the default value. As soon as name and URL are
filled, a new icon on sidebar will appear with the file explorer.
Dashboards
Accessing dashboards of Dask and Ray are currently supported. Dask dashboard can be accessed in two ways.
- Using Dask extension
- Using Dask dashboard application in dashboard category
Both proxy the same dashboard but in different ways. For example, dask extension will enable us to use dashboard components inside the JupyterLab instance as different tabs as shown in figure
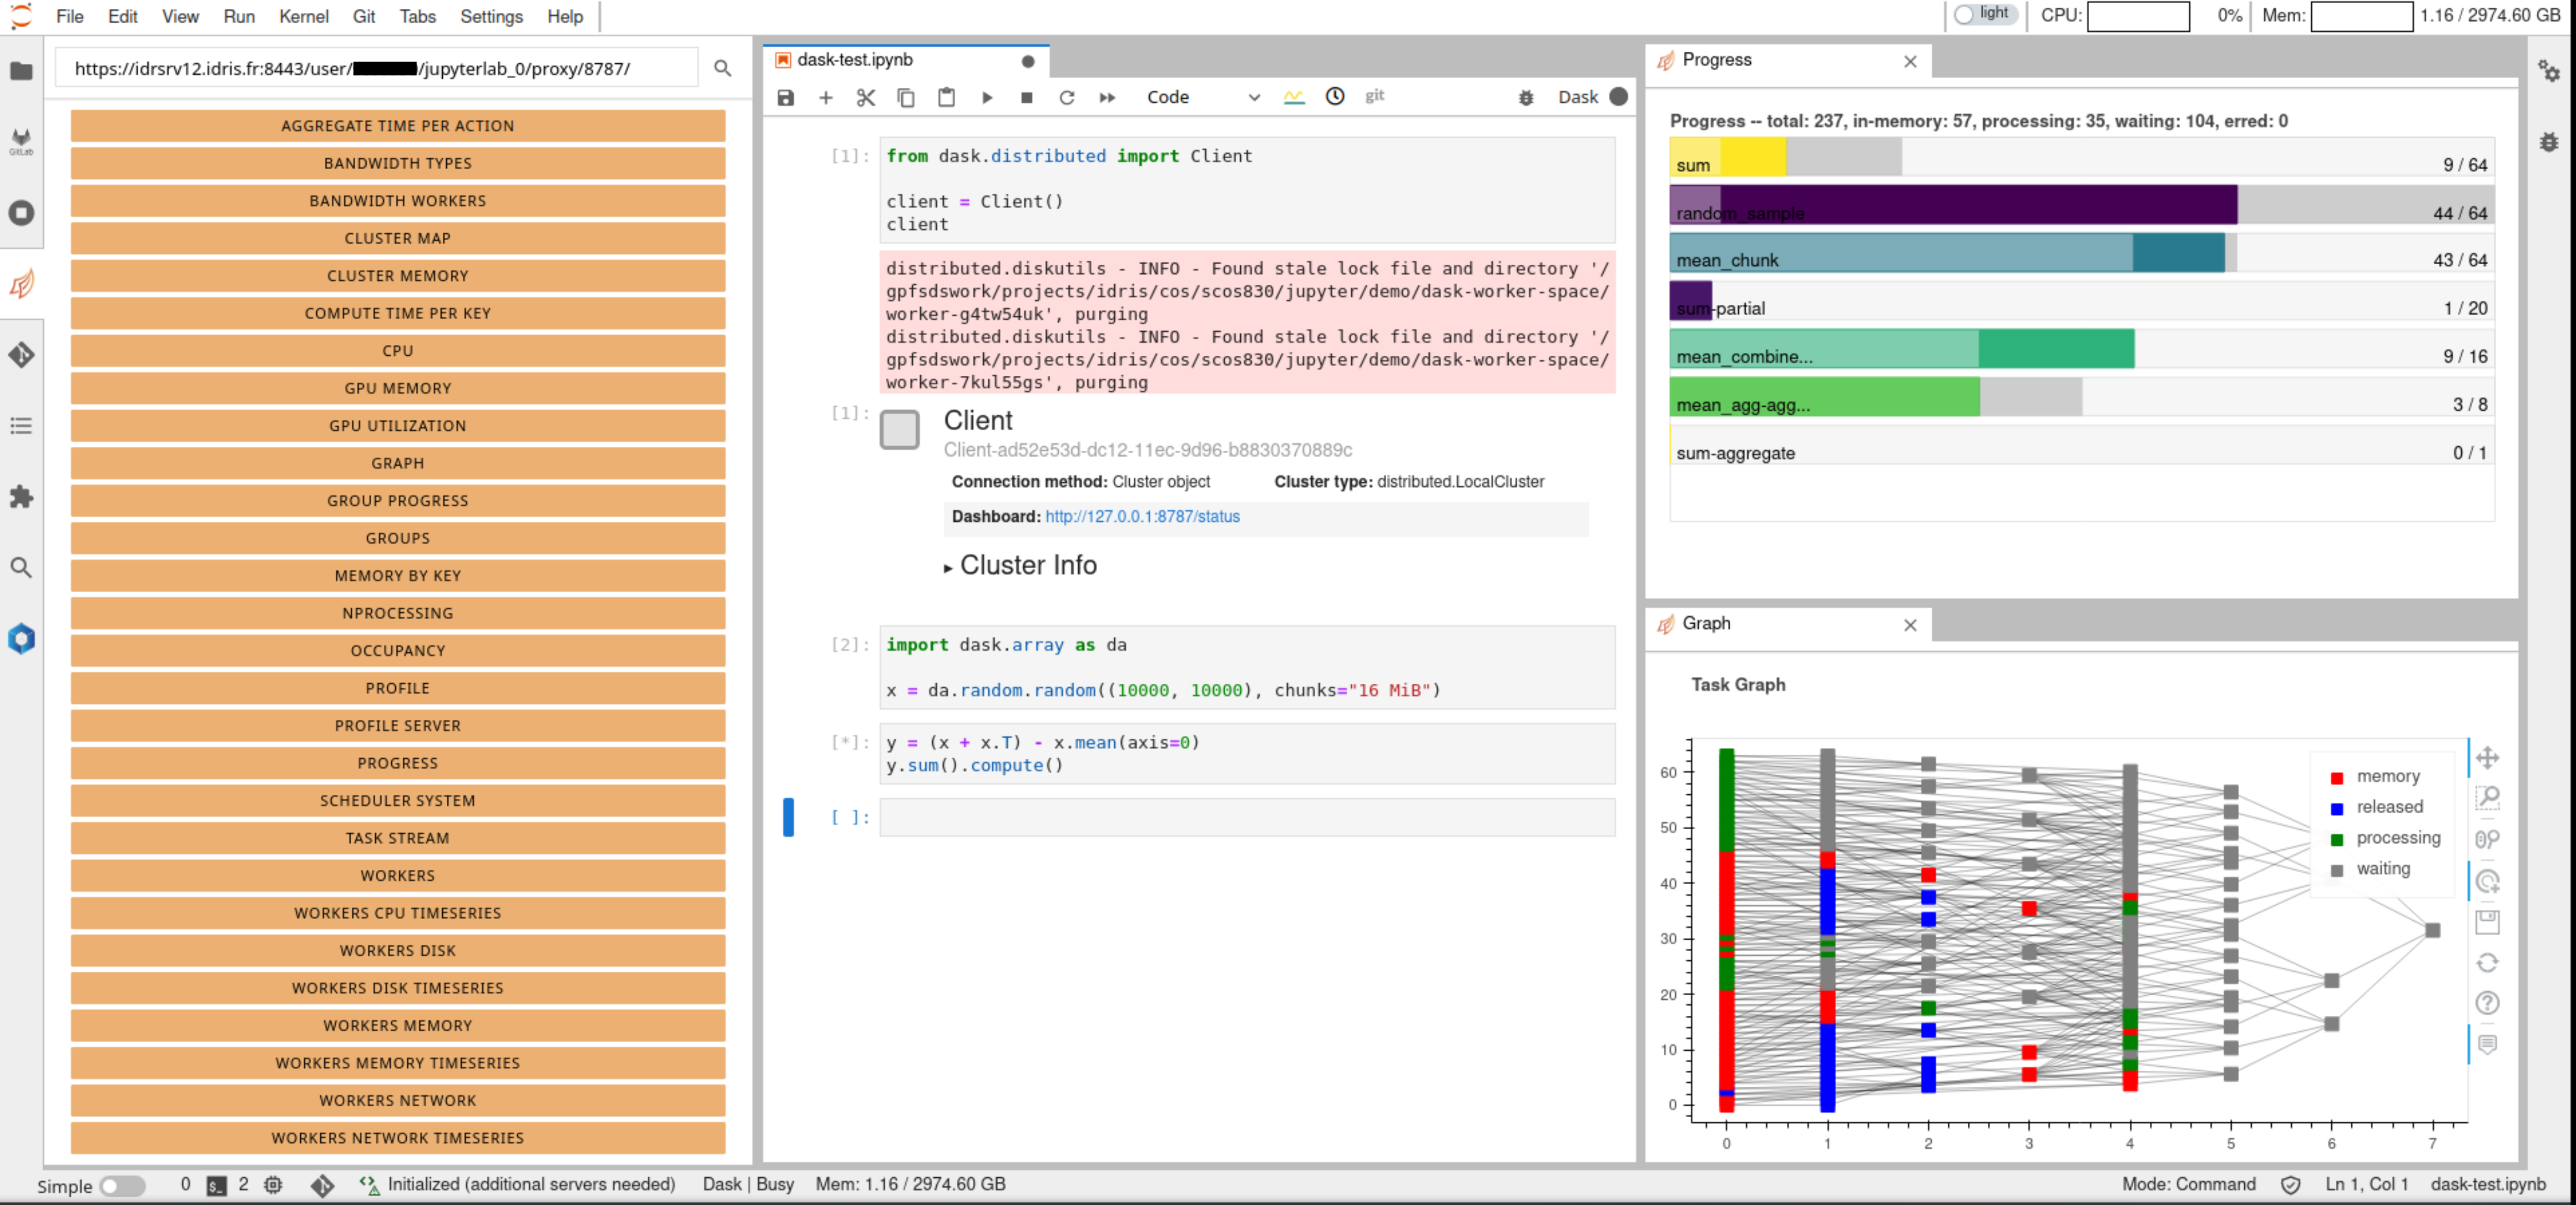
In order to access these dashboards, first we need to start a dask
cluster and then enter the URL where dask dashboard can be accessed on
the top left corner as shown in the figure. The URL is of the form
https://<jupyterhub_url>/user/<username>/<jupyterlab_name>/proxy/<dask_dashboard_port>/.
For instance, if user user001 spawned a JupyterLab instance named
jupyterlab_0 and dask dashboard is running at 8787, it can be accessed
at https://<jupyterhub_url>/user/user001/jupyterlab_0/proxy/8787/
If the user prefers to access the dashboard in a native way in a different browser tab, it can be done by launching Dask dashboard app under Dashboards category. Upon clicking the launcher icon, the user will be prompted to input the port at which dashbaord is running as shown in the figure
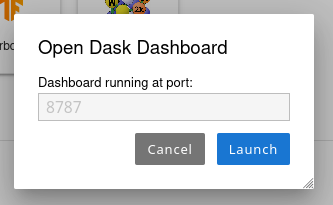
If there is an active dashboard running at the given port, a new tab will open with dashboard.
Same goes with the Ray dashboard, where clicking the icon will prompt the user to input the port at which Ray dashboard is running.
Documentation
In order to give an easy access to documentation to several softwares and code bases, documentation icons are provided in the launcher under the category Documentation as follows
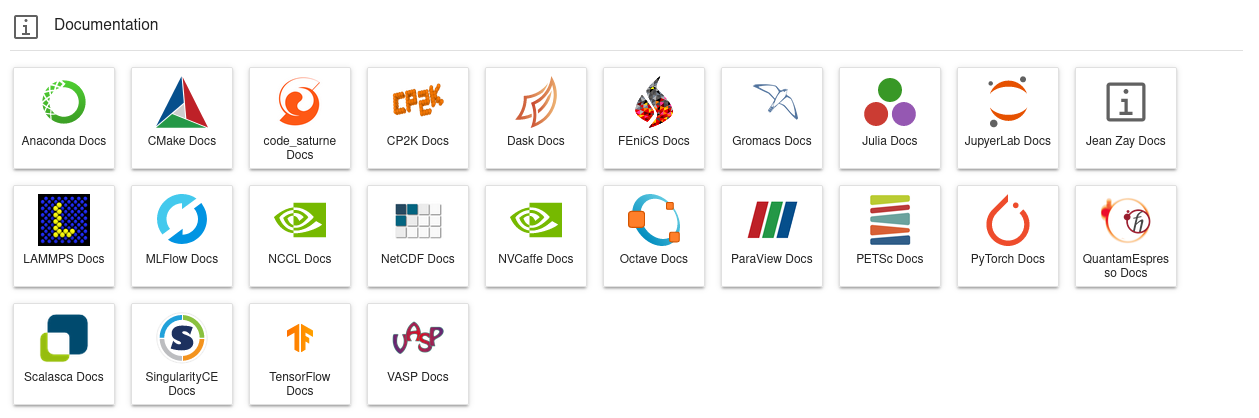
Upon clicking any of these icons, users will land in the official documentation portals of the respective software.