TensorBoard
This page was translated by an AI (LLM) with a cursory human check and is awaiting full review.
Machine Learning algorithms are generally computationally expensive. It is therefore essential to quantify the performance of your Machine Learning application. The graphical tool TensorBoard was created for this type of study.
The TensorBoard visualisation tool is available on Jean Zay via the IDRIS JupyterHub (Documentation).
To access TensorBoard, you need to be in an environment where the tool has been installed:
- if you have opened a JupyterLab instance, you will first need to load a module (tensorflow, pytorch, ...) containing TensorBoard as indicated in the JupyterHub documentation (see the Environment Modules section)
- if you have directly opened a TensorBoard instance on a compute node (
Spawn server on SLURM node+Frontend = Tensorboard), the tool is available without any further action on your part.
TensorBoard Features
TensorBoard offers different visualisation tabs. The main tools are:
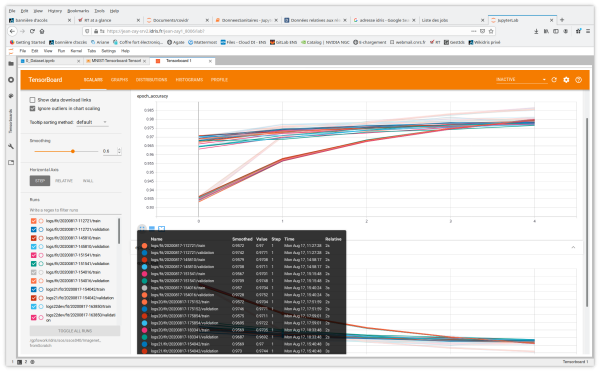
- Scalars displays the evolution of the loss and metrics at each epoch by default (It is possible to adapt it to monitor the training speed, learning rate and other scalar values.)
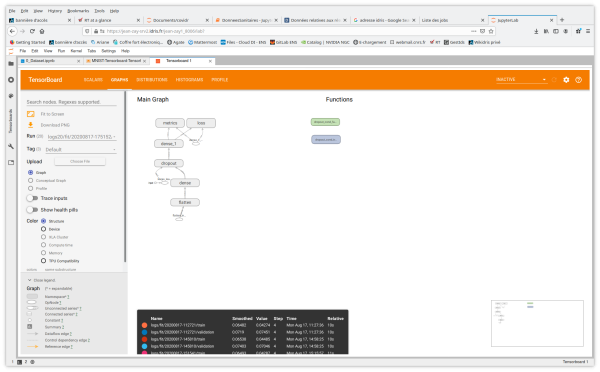
- Graphs helps to visualise the structure of your model
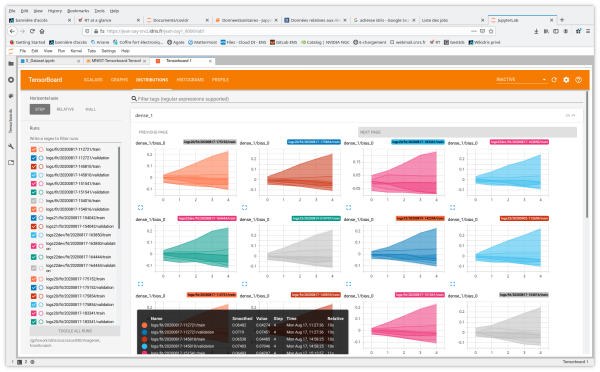
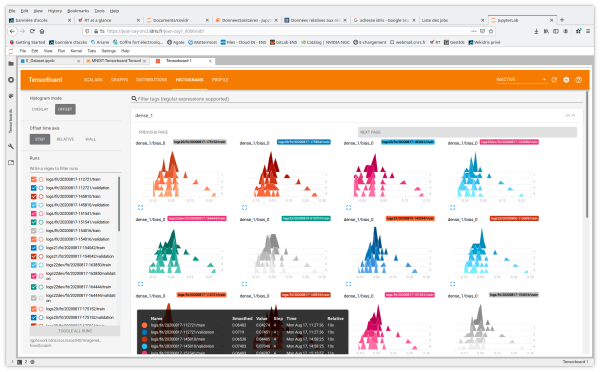
- Distributions and Histograms show the distribution of weights and biases at each epoch
 |  |
|---|---|
 |  |
You also have access to the tabs and features Image Data, Hyperparameter Tuning, Embedding Projector for Natural Language Processing applications, What If Tool and Debugger V2.
Training a model with TensorBoard callbacks
To benefit from the features offered by TensorBoard, you need to instrument your code.
Instrumenting your TensorFlow code
To generate TensorBoard logs in the appropriate format as output from your TensorFlow application, you need to:
- create a TensorBoard callback to capture the metrics (here
profile_batch = 0to disable the profiler)
# Create a TensorBoard callback
logs = "logs/" + datetime.now().strftime("%Y%m%d-%H%M%S")

tboard_callback = tf.keras.callbacks.TensorBoard(log_dir = logs,
                                                 histogram_freq = 1,
                                                 profile_batch = 0)
- call it during model training
# Train model
model.fit(ds_train,
         epochs=2,
         validation_data=ds_test,
         callbacks = [tboard_callback])
Instrumenting your PyTorch code
To generate TensorBoard logs as output from your PyTorch application, you need to
- define a
writer
from torch.utils.tensorboard import SummaryWriter

# default `log_dir` is "runs" - we'll be more specific here
writer = SummaryWriter('runs/fashion_mnist_experiment_1')
- insert TensorBoard callback commands suitable for the results you wish to visualise. For example:
# TensorBoard callback for Scalars visualisation
# here we report running loss value at each iteration i
writer.add_scalar('training loss',
                  running_loss / 1000,
                  epoch * len(trainloader) + i)
# TensorBoard callback for ImageData visualisation
writer.add_image('four_fashion_mnist_images', img_grid)
# TensorBoard callback for Graphs visualisation
writer.add_graph(net, images)
# TensorBoard callback for Embedding Projector visualisation
writer.add_embedding(features,
                    metadata=class_labels,
                    label_img=images.unsqueeze(1))
# TensorBoard callback for Weights/Bias histogramms
writer.add_histogram('distribution_weight', np.concatenate([j[1].detach().cpu().numpy().flatten()
                                                    for j in model.named_parameters()
                                                    if 'bn' not in j[0] and 'weight' in j[0]]), epoch + 1)
writer.add_histogram('distribution_bias', np.concatenate([j[1].detach().cpu().numpy().flatten()
                                                    for j in model.named_parameters()
                                                    if 'bn' not in j[0] and 'bias' in j[0]]), epoch + 1)