CEEMS: energy measurement tool on Jean Zay
This page was translated by an AI (LLM) with a cursory human check and is awaiting full review.
What is CEEMS?
The CEEMS (Compute Energy & Emissions Monitoring Stack) energy measurement tool is available to Jean Zay users. It is an open-source tool (GitHub link) with online documentation (doc link).
Note that the CEEMS tool is based on data obtained at the compute node level. Therefore, it does not take into account aspects such as cooling, interconnect network, I/O, etc. If your goal is to evaluate your overall carbon footprint, including these aspects, you can use the figures provided by GENCI on this subject (available here).
Accessing CEEMS
The CEEMS instance on Jean Zay is accessible via a Single Sign-On (SSO) service with your Jean Zay username and password, at the address: https://jean-zay-ceems.idris.fr. The login methods are the same as those used to access JupyterHub, as indicated on the Jupyterhub page.
 CEEMS Homepage
Using CEEMS
From the homepage, go to the menu Home > Dashboards > SLURM Job Metrics > User Job Summary if you are not already there.
The top of the displayed page then looks like this:
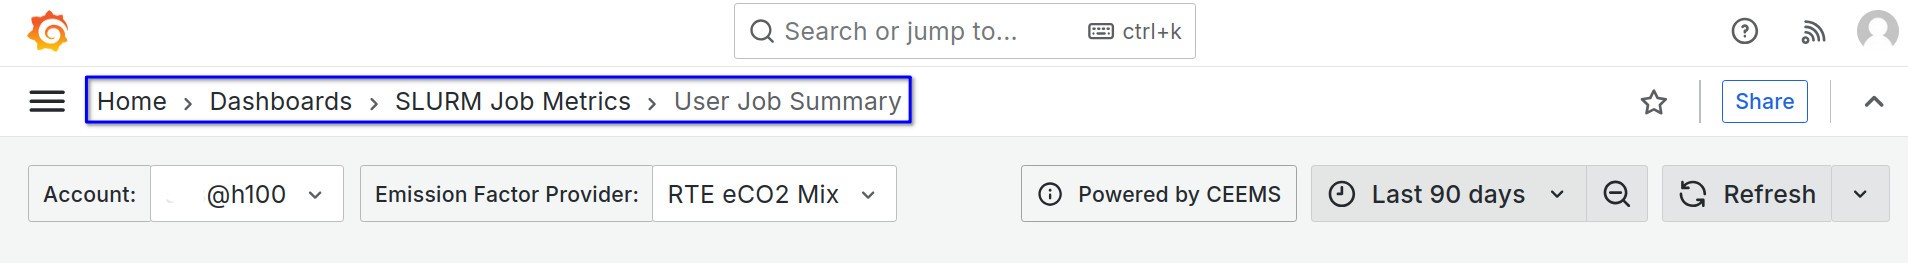 Path to the "User Job Summary" section
Measurement Parameters
Account
On this page, you can select the desired type of hours via the drop-down menu Account (…@cpu, …@v100, …@A100 or …@H100). The available choices, as well as the default option, depend on the hours allocated to the project.
CO2 Emission Coefficient
You can also choose the CO2 emission coefficient to use (variable depending on the chosen reference) using the drop-down menu Emission Factor Provider. It serves as the basis for calculating the amount of CO2 emitted by your jobs. You can find information on the possible choices in the "README" box on the right side of the page.
Data Analysis Period
You can choose the data analysis period via the drop-down menu Last 90 days (which is the default value).
Refresh
Note that the drop-down menu Refresh on the right allows you to disable automatic refresh or enable it by choosing the frequency.
Displays
Following the previous choices, you can view the corresponding statistics for:
- overall usage by the user, in the “Aggregate Usage Statistics of User…” section:

- overall usage for the project, in the “Aggregate Usage Statistics of Project…” section:

- the distribution of energy and emissions usage within the project, in the “Breakdown of Energy and Emissions Usage …” section:

- and metrics for your jobs, in the “Job Metrics …” section:

Each section contains a README that provides an introduction to the relevant section and a definition of the aggregated metrics presented.
Job Details
The “Job Metrics…” section lists your jobs for the selected partition and analysis period. They appear a few minutes after the jobs start (at most 30 min). The information is then updated in real-time (according to the chosen refresh duration).
Only jobs longer than 5 minutes are displayed!
By clicking on a job in the “Job Metrics” list, you access the “Single Job Metrics” dashboard. In this dashboard, you will have, for this job, detailed statistics per node (via the “Compute Node” drop-down menu) and possibly per GPU (via the “GPU” drop-down menu), depending on the type of job (CPU or GPU).
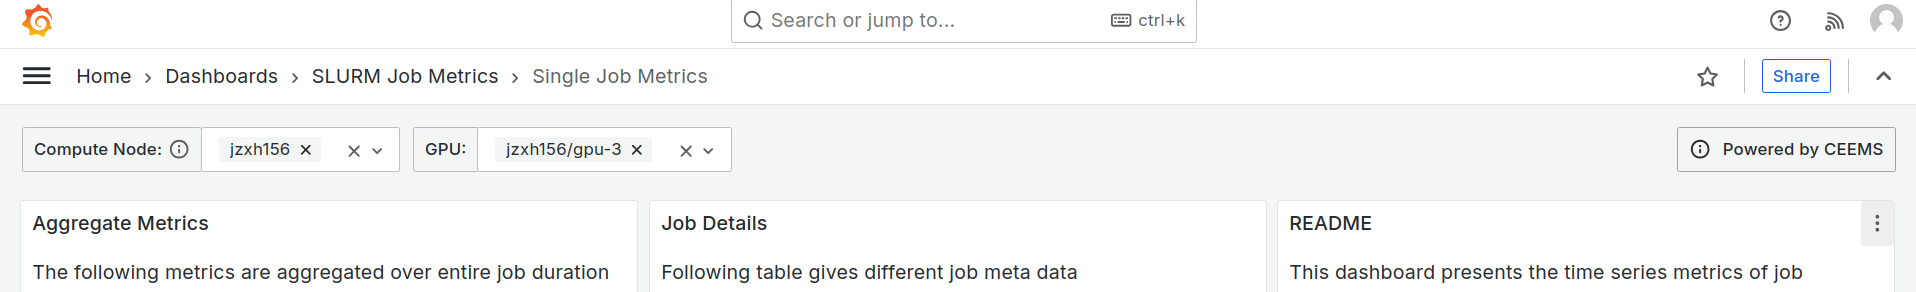 “Single Job Metrics” Dashboard
The “Single Job Metrics” dashboard includes several sections, such as CPU Stats, GPU Stats and GPU Profiling Stats. The definitions of the metrics presented in these sections are available in the README of this page. This page also provides profiling data and I/O statistics. Note that to enable some of these features, you need to configure the corresponding environment variables, as indicated in the README.