Profiling Python codes
This page was translated by an AI (LLM) with a cursory human check and is awaiting full review.
Here we present techniques to specifically track the evolution of CPU memory and instruction duration during the execution of a Python script.
The proposed methods are easy to implement and each has its strengths.
Summary
Here is a summary of the specifics of each:
| type | information | Speed Impact | Limitations | |
|---|---|---|---|---|
| CEEMS | Memory, CPU, GPU, power usage and CO2 emissions, flame graph | Tracks memory, CPU and GPU usage, can display the memory usage trace, performed automatically for Slurm jobs | Results are only available for jobs longer than 5 minutes. | |
| Scalene | Memory, CPU, GPU | Complete or function-specific profiling via decorator, very comprehensive table view (CPU, memory, GPU possible) | ++ | Causes CUDA Out Of Memory Error when used with PyTorch workers. |
| Memory Profiler | Memory | Complete or function-specific profiling via decorator, aggregated view | +++ | Line-by-line profiling of parallel processes may mix the output of each process. |
| Fil profiler | Max Memory | Memory profiling generating a flame graph to find the instruction causing a peak allocation | + | |
| py-spy | flame graph, call stack, real-time tracking | Python package for real-time monitoring of a Python process and its sub-processes | ||
| Nsight Systems | Memory, CPU, GPU | A NVIDIA tool for displaying memory usage (CPU & GPU) and the precise execution trace of the launched code | ? | |
| Manual investigation | Memory, CPU | Two Python codes that allow you to punctually observe a function (duration) or a structure (memory) |
The most comprehensive tool is CEEMS, which retrieves power consumption and memory usage information of jobs directly from the sensors integrated into the hardware.
CEEMS only takes into account jobs that last more than 5 minutes.
Nsight Systems is a NVIDIA tool capable of profiling an entire code and displaying CPU, GPU and memory usage throughout execution via a graphical interface, as well as identifying code improvement opportunities.
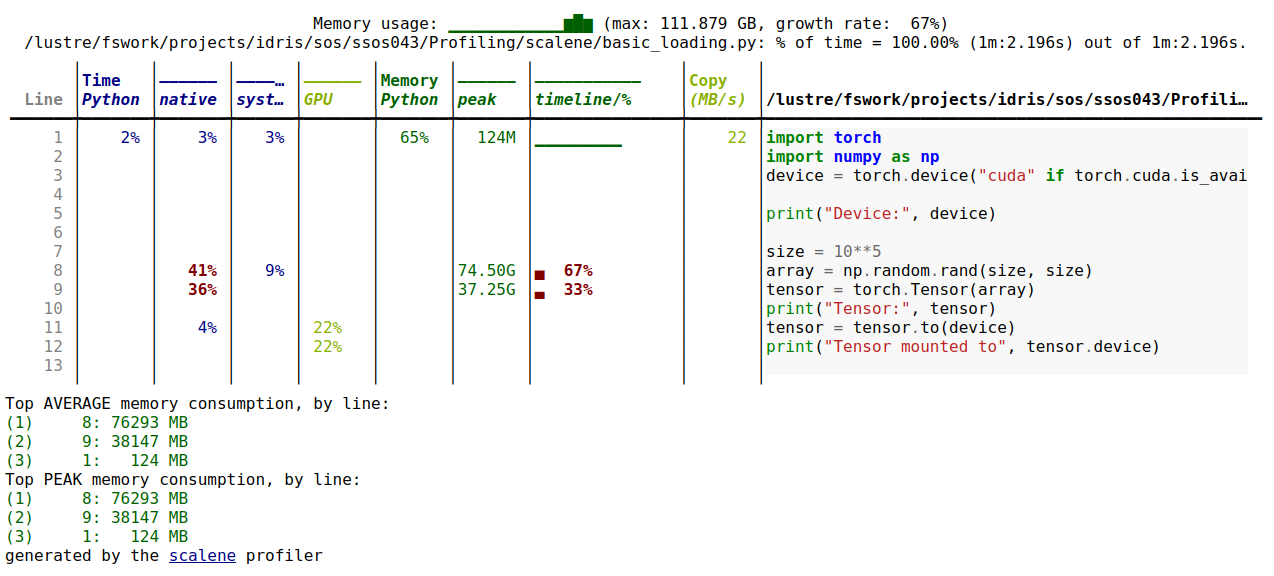
The Scalene tool generates a file providing exhaustive information, line by line of the profiled code (CPU, memory, GPU, number of calls). It also has the advantage of not slowing down the execution too much (+33% observed in a data processing experiment).
The Memory Profiler tool stands out by offering a graphical view of memory occupation over time:
- line by line like Scalene but a function called several times appears (with its content) as many times as there are calls;
- the graphical display makes it easy to see peaks and possible memory leaks (it is normally possible to annotate the called functions on this graph but this does not seem to be functional at the moment).
Both Scalene and Memory Profiler tools require calling the code via an executable (respectively scalene and mprof) and/or adding lines of code (an import and decorators).
The Fil profiler module is the most limited in terms of functionality but it can be interesting if you are used to graphical visualisations of function calls in a code.
The py-spy tool offers the possibility to track in real time the execution of its Python process. It can create a trace of the memory peak or output the callstack in real time of all threads and sub-threads of the process. Very useful for identifying blocking threads.
- Do the profiling by reserving a compute node dynamically via
srunrather than via a job launched bysbatch. Be aware of the waiting time to obtain computing resources which varies depending on the machine load! - Do not keep profiling active if you are no longer experimenting to preserve your computing hour quota!
- Check the latest versions of the libraries and new features.
- Try to put the parts of the code to be profiled in the form of functions or classes (for the use of decorator).
- It happens that the profilers generate core files, don't forget to delete them as they can be very large.
- Be careful, if you have an out of memory during a dynamic session on a compute node, you will only be informed when you leave this session and not when the executed program fails!
Setting up Python tools
If tools are not available in the modules that interest you:
- you can request their installation from support (assist@idris.fr) specifying the module you are using;
- or you can install them yourself by overloading an existing module (
pytorch-gpu/py3/2.6.0in this example) with one of the following pip commands:
module load pytorch-gpu/py3/2.6.0
pip install --upgrade --user --no-cache-dir memory_profiler
pip install --upgrade --user --no-cache-dir filprofiler
pip install --upgrade --user --no-cache-dir scalene
pip install --upgrade --user --no-cache-dir py-spy
Some of these profilers are actively developed, so it may be advantageous to reinstall them with the pip --upgrade option even if versions are already available in the modules, to benefit from the latest features and bug fixes.
To use the executables of these tools (when they exist), it is necessary to modify the PATH variable before their calls:
-
By default, installations are done in your HOME so use the following command:
export PATH=$HOME/.local/bin:$PATH -
But if you have redefined the PYTHONUSERBASE variable, it is this variable that you must use:
export PATH=$PYTHONUSERBASE/bin:$PATH
CEEMS��
It is possible to access the energy report for each of your projects (for each hardware partition) as well as the average CPU and GPU usage of your jobs.
The default CEEMS dashboard

By clicking on a listed job, you then access a summary specific to this job with, among other things, the power consumption and an estimate of CO2 emissions. CEEMS also allows you to visualise memory, CPU and GPU usage over time.
CPU and GPU usage graphs of a job on CEEMS

Finally, by specifying export CEEMS_ENABLE_PROFILING=1 in the Slurm file, CEEMS will print the job trace.
The CEEMS memory trace of a Slurm job

Additional documentation is available on the dedicated page.
Scalene
For this tool, the code is executed via the command scalene rather than python:
- For example, for a text output in the terminal, use the following command:
scalene preprocess.py
- And to have an output in html format (the txt format is active by default) in a file, use the following command:
scalene --html --outfile profile.html preprocess.py
This gives this type of output:
Scalene output table
To profile only certain functions of the code, you need to add the @profile decorator (no import required):
@profile
def preprocess_data(dataframe, verbose=False):
    ...
We have observed that Scalene could cause frequent Out Of Memory errors with PyTorch codes, which are currently unexplained.
Memory profiler
This profiler offers two modes of operation, depending on whether you want a time graph of memory evolution and/or a text output of this evolution.
The basic mode produces a text file containing the evolutions of the allocated memory and requires adding the following instructions in the codes to be profiled:
# Import necessaire
from memory_profiler import profile

# Fichier de sortie du profiler
fp=open('memory_profiler.log','w+')

# Profiling de la fonction avec sortie dans le fichier choisi
@profile(stream=fp)
def create_tensor():
    ...
Note that the decorator @profile(stream=fp) can be used as many times as you want for as many different functions.
The code is then executed without change via the command python.
The file memory_profiler.log will then contain this type of information:
Line #    Mem usage    Increment  Occurrences   Line Contents
=============================================================
     7    356.1 MiB    356.1 MiB           1   @profile(stream=fp)
     8                                         def create_tensor():
     9    356.1 MiB      0.0 MiB           1       size = 10**5
    10  76652.2 MiB  76296.1 MiB           1       array = np.random.rand(size,size)
    11 114804.5 MiB  38152.3 MiB           1       _tensor = torch.Tensor(array) # Créé un objet Tensor
    12
    13 114809.9 MiB      5.4 MiB           1       device = torch.device("cuda" if torch.cuda.is_available() else "CPU")
    14 114809.9 MiB      0.0 MiB           1       print("Device:", device)
    15  76799.9 MiB -38010.1 MiB           1       _tensor = _tensor.to(device) # Le Tensor est déplacé vers la mémoire GPU
    16  76799.9 MiB      0.0 MiB           1       print("Tensor mounted to", device)
    17
    18    505.9 MiB -76294.0 MiB           1       del array # Suppression de l'objet "array" de la mémoire
It is possible to profile the entire code by launching it with the -m memory profiler option as follows:
python -m memory_profiler example.py
The second mode of operation allows you to obtain a graph of memory evolutions. The code must then be executed via the command mprof:
mprof run example.py
The execution then generates a file whose name is of the type mprofile_*.dat which can be interpreted to extract a graph via the command matplotlib.
To get the graph of the last profiling performed, simply do:
mprof plot
If you want to visualise another file, simply add its name to the command line.
Example of Memory Profiler graph

It is possible to display on the graph when a function starts and ends by using the @profile decorator (and omitting the from memory_profiler import profile instruction).
Note that generating the graph requires access to a graphical environment (on Jean Zay, use the visualisation nodes), the simplest being to use this functionality on your local computer.
The Memory Profiler tool has many modes, which can be seen by running mprof without arguments, then mprof <mode> -h for the options related to a given mode.
Fil profiler
This profiler is the open source version of a commercial tool. It is quite limited but in return its impact on the execution time of the program is less.
To obtain a flame graph (and therefore the location of the portion of code that is most memory-intensive), you need to launch the code as follows:
fil-profile run example.py
This generates a directory containing an html file and 2 vector images (svg) each containing a flame graph:
Fil-profiler flame graph

To profile a part of the code, simply modify the code as follows:
from filprofiler.api import profile

_tensor = profile(lambda: create_tensor(), "fil-result")
and then execute the code in this way (be careful to use fil-profiler python and not fil-profile run):
fil-profile python example.py
Unlike the decorator used by the other profilers, this way of proceeding allows you to profile a function by respecting conditions (to be implemented yourself in the code via an if … else …), for example to profile only on the master rank in case of multi-task code.
py-spy
The py-spy package contains three different utilities: record, top and dump which respectively generate a flame graph, display in real time the activity within the Python process and display the current call stack for each Python thread.
To use py-spy it is necessary to first launch your Python code in parallel via a Slurm job and then connect to the job's compute node via ssh.
Once the job is launched, the command squeue --me allows you to retrieve the assigned compute node, and ssh <nœud> allows you to access it (here nœud=jzxh017):
sbatch training.pysubmitted batch job 24010squeue --me JOBID PARTITION NAME USER ST TIME NODES NODELIST(REASON) 241010 GPU_p6 training my_name R 0:04 1 jzxh017ssh jzxh017# The shell is now on node jzxh017You then need to use the command top to list the processes running on the node, and identify the Python process to be profiled and its Process ID (PID):
top PID USER PR NI VIRT RES SHR S %CPU %MEM TIME+ COMMAND 181501 use01jz 20 0 46,5g 147840 0 S 97,4 0,1 1:16.79 wandb 172547 use02jz 20 0 244216 5120 4480 R 69,7 0,0 3:07.09 rsync1769193 my_name 20 0 298028 31204 4480 R 63,2 0,0 0:18.65 python 181192 use05jz 20 0 72,5g 512764 17280 S 59,0 0,3 0:37.22 gitPerformance report
To create a flame graph, simply use the subcommand record of py-spy by indicating the desired process via --pid <PID>:
# Pour créer un flamegraph
py-spy record -o profile.svg --pid 1769193
SVG output of py-spy record

Real-time performance
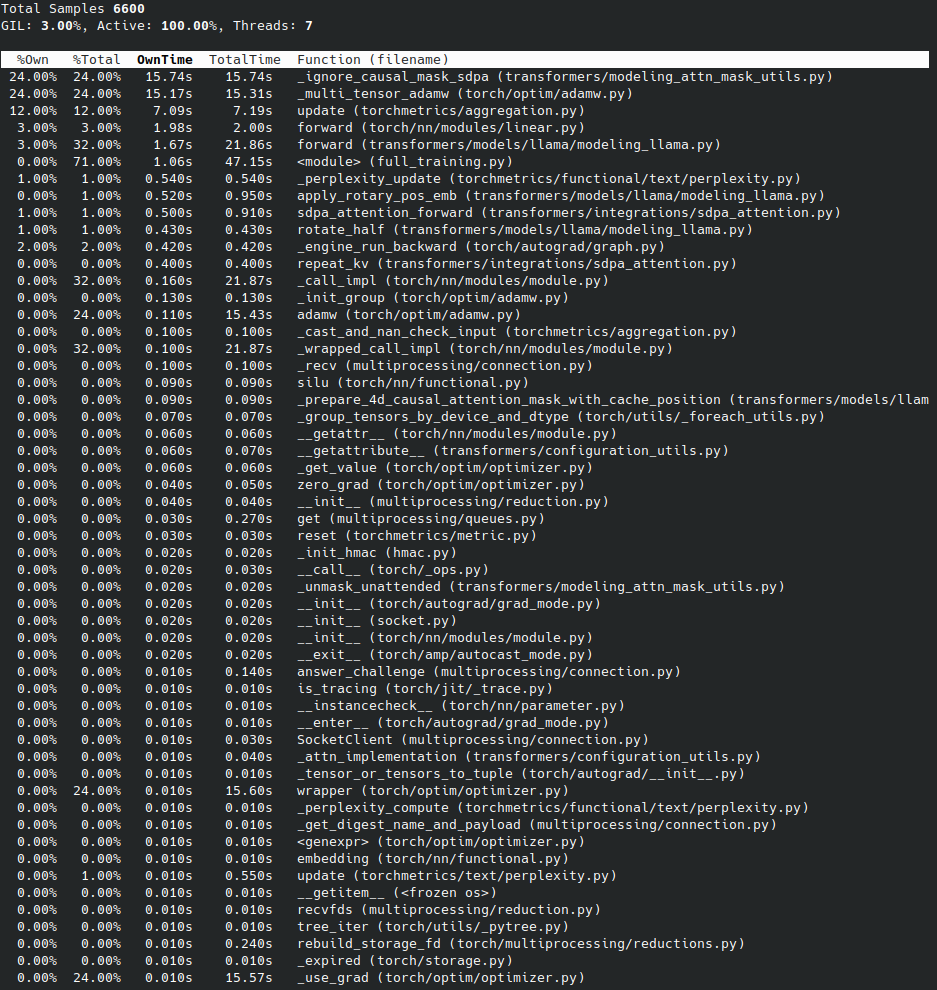
The subcommand top of py-spy is similar to the Unix top command and displays in real time the functions that consume the most time in the program for the process selected via --pid <PID>:
py-spy top --pid 1769193
This command continuously updates the display, thus helping you to quickly identify performance bottlenecks.
Output of py-spy top
Call stack
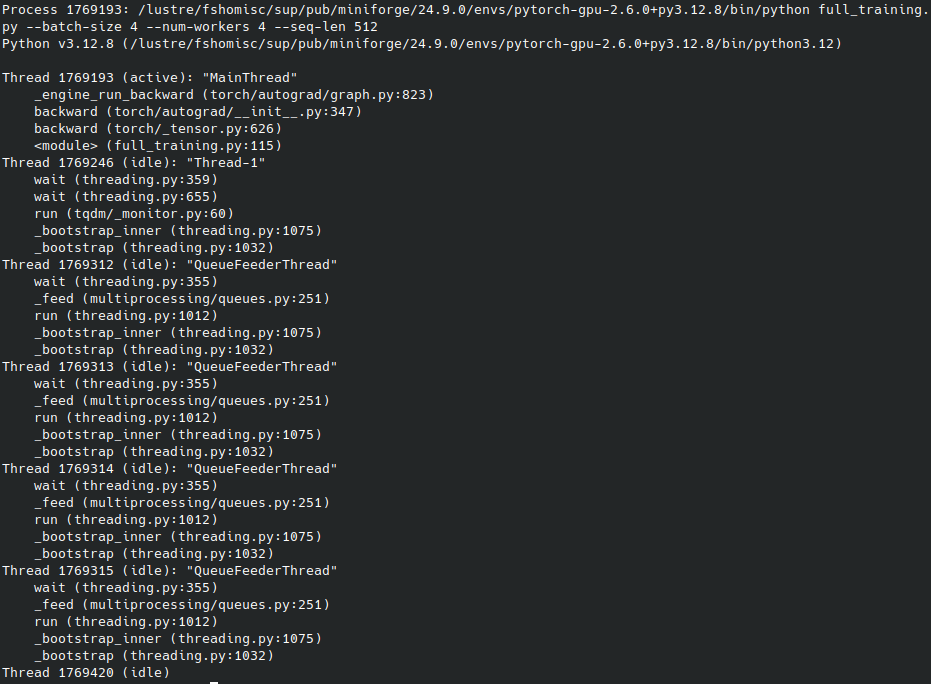
To get the call stack in real time, simply use the subcommand dump of py-spy by indicating the desired process via --pid <PID>:
# Pour obtenir le callstack instantané des threads
py-spy dump --pid 1769193 > full_training.dump
This can be useful for detecting blockages or other execution problems.
Output of py-spy dump
Nsight Systems (NVIDIA)
Nsight-systems is available on Jean Zay via the modules-files nvidia-nsight-systems (see the output of the command module avail nvidia-nsight-systems). Its use requires loading the desired version via the command module load nvidia-nsight-systems/.... Then, simply use the command nsys profile as follows:
srun nsys profile python example.py
This will generate a file reportX.nsys-rep which will be interpretable by the other commands nsys.
When executing several processes to be profiled, it is possible to launch a session with nsys start then end it with nsys stop, profiling each desired process with nsys launch.
Here is an example of a Slurm job:
#!/bin/bash
#SBATCH --job-name=nsys_example
#SBATCH --output=%x_%j.out
#SBATCH --error=%x_%j.out#err
#SBATCH --gres=gpu:1
#SBATCH --nodes=1
#SBATCH --ntasks-per-node=1
#SBATCH --hint=nomultithread
#SBATCH --time=00:05:00
#SBATCH --cpus-per-task=24
#SBATCH -C h100


## load module
module purge
module load arch/h100
module load pytorch-gpu/py3/2.6.0
module load nvidia-nsight-systems/2024.7.1.84

## echo of launched commandes
set -x

nsys start
srun nsys launch python example.py # code profilé
srun python post.py # code intermédiaire non-profilé
srun nsys launch python example2.py # code profilé
nsys stop
Manual and punctual investigation
This is the least intrusive method to explore parts of code, especially if you suspect where a potential problem might be.
These codes can be gathered in a file tools.py (to be made accessible via $PYTHONPATH for example).
Information on the execution duration of a function
Simply define the following functions:
import time
from functools import wraps

def convert_time(seconds):
    return time.strftime("%H:%M:%S", time.gmtime(seconds))

def timing(func):
    @wraps(func)
    def wrap(*args, **kw):
        start_time = time.time()
        result = func(*args, **kw)
        duration = time.time() - start_time
        print(f"________ Duration of {func.__name__}(): {convert_time(duration)} \t {duration} seconds")
        return result
    return wrap
This function timing is then used via a decorator:
from tools import timing

@timing
def suspicious_function():
    ...
The way to execute the code is unchanged.
Similar information to the following will appear in the program output (or in the file defined via the Slurm directive --output if launched via sbatch).
________ Duration of suspicious_function(): 00:00:18 18.34224474 seconds
Information on reserved memory
This method is not necessarily reliable, and may underestimate the actual memory occupation (which is also the case with the tools presented above). It may also not be adequate depending on the complexity of the data structure you wish to evaluate (see the handlers in the attached code).
In the same spirit as the function timing above, we will define in a file tools.py, the following functions:
    from sys import getsizeof, stderr
    from itertools import chain
    from collections import deque
    try:
        from reprlib import repr
    except ImportError:
        pass

    def convert_byte(num, suffix="B"):
        for unit in ["", "Ki", "Mi", "Gi", "Ti", "Pi", "Ei", "Zi"]:
            if abs(num) < 1024.0:
                return f"{num:3.1f}{unit}{suffix}"
            num /= 1024.0
        return f"{num:.1f}Yi{suffix}"

    def total_size(object_name, o, handlers={}, verbose=False):
        """ Returns the approximate memory footprint an object and all of its contents.
        Automatically finds the contents of the following builtin containers and
        their subclasses:  tuple, list, deque, dict, set and frozenset.
        To search other containers, add handlers to iterate over their contents:
            handlers = {SomeContainerClass: iter,
                        OtherContainerClass: OtherContainerClass.get_elements}
        """
        dict_handler = lambda d: chain.from_iterable(d.items())
        all_handlers = {tuple: iter,
                        list: iter,
                        deque: iter,
                        dict: dict_handler,
                        set: iter,
                        frozenset: iter,
                       }
        all_handlers.update(handlers)     # user handlers take precedence
        seen = set()                      # track which object id's have already been seen
        default_size = getsizeof(0)       # estimate sizeof object without __sizeof__

        def sizeof(o):
            if id(o) in seen:       # do not double count the same object
                return 0
            seen.add(id(o))
            s = getsizeof(o, default_size)

            if verbose:
                print(f"________ Memory consumption of {object_name} ({type(o)}) {convert_byte(s)}")

            for typ, handler in all_handlers.items():
                if isinstance(o, typ):
                    s += sum(map(sizeof, handler(o)))
                    break
            return s

        return sizeof(o)