This page was translated by an AI (LLM) with a cursory human check and is awaiting full review.
Introduction to ParaView

Presentation
ParaView is an open-source, multi-platform software for 2D-3D visualisation. ParaView allows the visualisation of large volumes of data in parallel. The reference site for ParaView is www.paraview.org. This document is a short introduction to ParaView, describing the graphical user interface, the different data structures and formats, as well as examples of using vtk formats. The "Documentation" section provides references and tutorials describing the use of the ParaView site's user interface.
User Interface
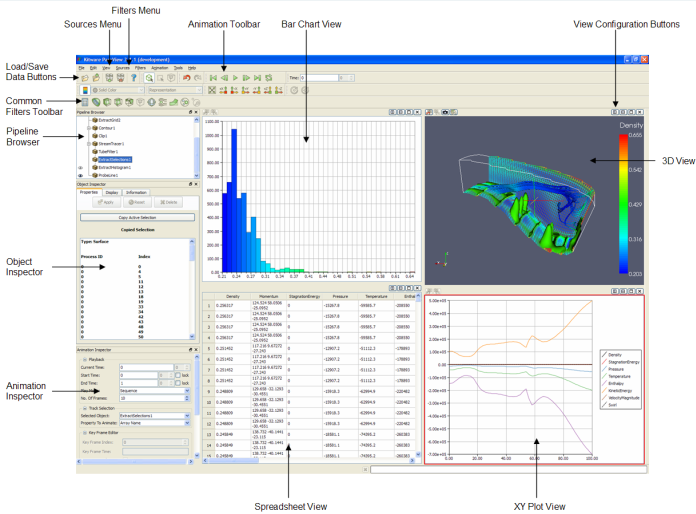
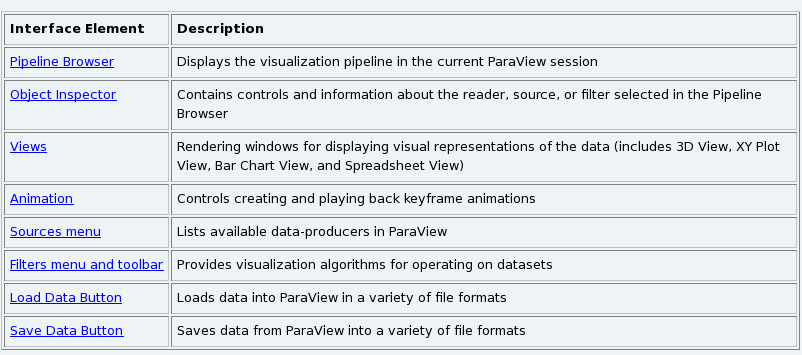
The user interface includes a number of menus described below:
View Menu
The View menu allows you to modify the user interface with the Toolbars submenu, display statistics on the data read (Statistics View) and present or hide the Pipeline Browser and Object Inspector menus.
- Pipeline Browser
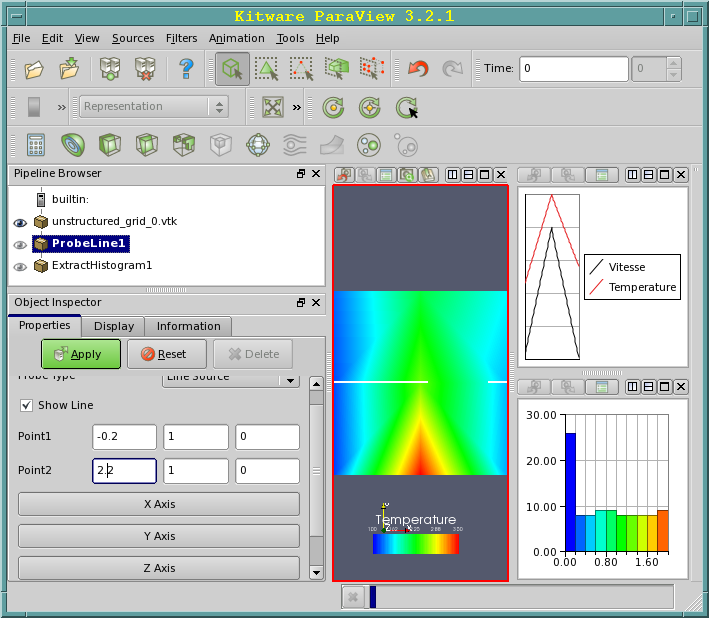
ParaView manages data reading and exploitation through a pipeline. This pipeline allows you to visualise how the data reading and the operations performed or in progress are linked and to intervene to delete an object (right-click delete), display it or not (left-click on the eye).

- Object Inspector
Allows you to view and modify the parameters of a pipeline object, three submenus are available. The Properties submenu presents the configurable options for the object, the Display submenu shows how to visualise the object and Informations provides statistics on the object.
Sources Menu
ParaView has several possibilities with the Sources menu to generate or annotate graphical objects.
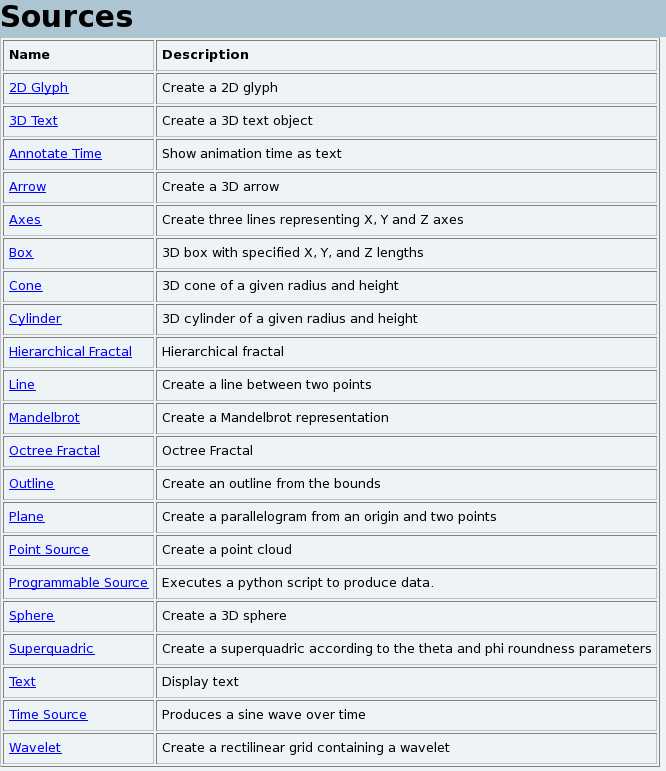
An example of creating and animating a sphere is presented in the Animation menu.
Filters Menu
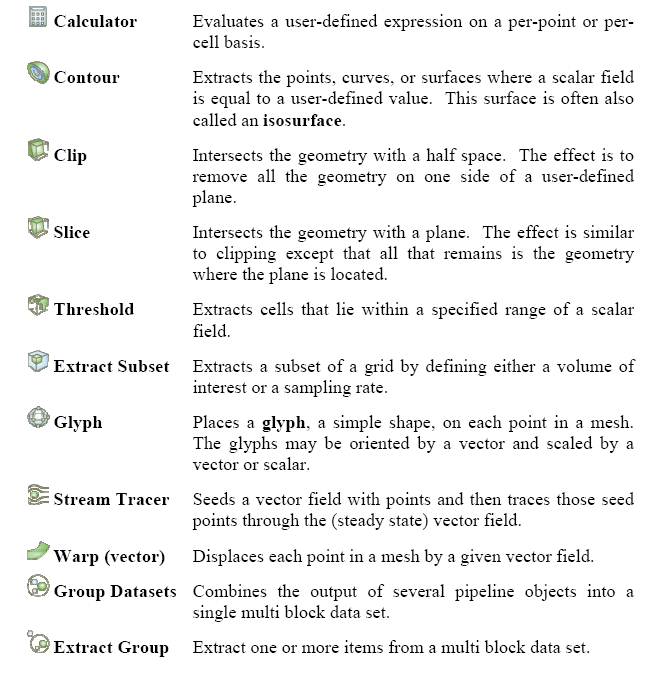
Filters are graphical tools that allow you to perform a number of common operations on the data read, such as isosurface calculations, slices, etc. The Filters menu includes more than 80 filters classified into different categories: Recent, Common, Data Analysis, Alphabetical. Only those that are actually compatible with the data to be represented are displayed (the others are greyed out).
Common Filters
Data Analysis Filters
ParaView has a number of tools for analysing the data to be represented on a line (ProbeLine) or on the entire data set (ExtractHistogram).
Animation Menu
ParaView offers animation possibilities accessible from the menu View → Animation Inspector and View → Animation View. Different animation modes are possible:
- Sequence: animation performed from the number of images (No Frames) chosen.
- Real Time: animation performed within a given time.
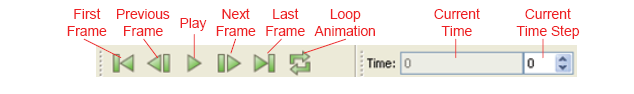
The animation is created with the following commands:
It is possible to save the animation in avi format: File → Save Animation.
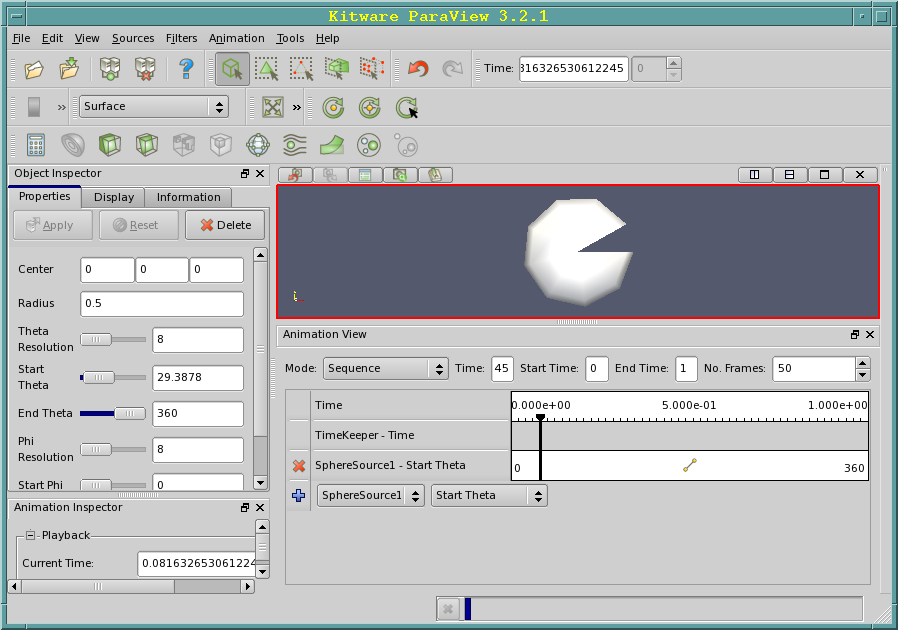
Example of creating and animating a sphere with the following operations:
-
Menu Sources → Sphere → Object Inspector
- Change End Theta 360 → 300 Apply
-
Menu View → Animation View
- Change the number of images No. Frames from 10 → 50 (sequence mode)
- Open the SphereSource1 widget from the Animation View window and select Start Theta
-
Start the animation with the menu Animation → Play
It is possible to save the animation in avi format with the menu File → Save Animation.
Data Format
ParaView has many possibilities for reading data, we can distinguish the
proprietary formats inherited from the past (simple legacy formats) and the
XML formats. These formats use different types of geometry
representation.
The Different Types of Geometry Representation
ParaView uses the following geometric representations for its proprietary formats.
- Image Data Set of points or cells on a regular rectangular grid. The rows, columns and planes are parallel to the X, Y, Z axes.
- Rectilinear Grid Set of points or cells on a regular rectangular grid. The rows, columns and planes are parallel to the X, Y, Z axes. If the data topology is regular, the geometry is only partially so, as the space between the points is variable.
- Structured Grid Set of points with a regular topology and an irregular geometry defined by a set of coordinates.
- Unstructured grid Set of points with a completely unstructured topology and geometry. An unstructured grid is defined by points, cells and cell types.
- Polygonal Data Sets of primitives (points, lines, polygons, triangles or any other structures) used to represent the model to be traced
ParaView has readers adapted to certain types of predefined files that are compatible with a large number of software. Here is the list (continuously evolving) of the main readers available:
| Name | Description |
|---|---|
| AVS UCD reader | Dataset in AVS UCD format (.inp) |
| BYU reader | Movie.BYU file (.g) |
| DEM reader | Dataset in DEM format (.dem) |
| EnSight reader | EnSight file (.case, .sos) |
| ExodusIIReader | Exodus II file |
| Facet Reader | Dataset in Facet format (.facet) |
| Gaussian Cube reader | Gaussian Cube data file (.cube) |
| PDB reader | PDB(Protein Data Bank) file |
| PLOT3D reader | PLOT3D file (.xyz) |
| Phasta reader | Dataset stored in the Phasta format (pht) |
| PLY reader | PLY polygonal file (.ply) |
| PNG reader | PNG (Portable Network Graphics) file (.png) |
| POP reader | POP (Parallel Ocean Program) file (.pop) |
| PVD reader | ParaView's PVD file format (.pvd) |
| SESAME reader | SESAME data file (.sesame) |
| VRML reader | VRML 2.0 file (.wrl) |
| VTK reader | Legacy VTK files(.vtk, .vtp, .vtu, .vti, .vts, .vtr) |
| VTK partitioned reader | Partitioned Legacy VTK files (.pvtk, .pvtu, .pvti, .pvts, .pvtr) |
| VTK Multi Block reader | VTK Multi Block files(.vtm, .vtmb, .vtmg, .vthd, .vthb) |
| XDMF reader | XDMF (eXtensible Data Model and Format) data file .xmf |
| XML reader | VTK XML data file format |
The "simple legacy format" vtk formats
The proprietary formats inherited from the past (simple legacy formats) are
the simplest to use. These formats come from vtk and are described in
detail here.
The user also has the possibility to define their own type of data
structures for reading or writing.
General Structure of a vtk File
The general structure of a vtk file is as follows:
\# vtk DataFile Version x.x   Header
Fichier vtk                   Titre au choix
ASCII - BINARY                Type de données
DATASET type                  Type de Géométrie/topologie : STRUCTURED_POINTS STRUCTURED_GRID RECTILINEAR_GRID UNSTRUCTURED_GRID POLYDATA FIELD
POINT_DATA n CELL_DATA n      Attributs des données (n=nb de points ou cellules)
Geometry Description
-
Structured Points
DATASET STRUCTURED_POINTSDIMENSIONS nx ny nzORIGIN x0 y0 z0SPACING sx sy sz- nx ny nz = grid dimensions
- x0 y0 z0 = origin
- sx sy sz = spacing in x, y, z
-
Rectilinear Grid
DATASET RECTILINEAR_GRIDDIMENSIONS nx ny nzX_COORDINATES nx [dataType]x0 x1...x(n-1)Y_COORDINATES ny [dataType]y0 y1...y(n-1)Z_COORDINATES nz [dataType]z0 z1...z(n-1)- nx ny nz = grid dimensions
- dataType = float or int
-
Structured Grid
DATASET STRUCTURED_GRIDDIMENSIONS nx ny nzPOINTS N [dataType]x0 y0 z0x1 y0 z0x0 y1 z0x1 y1 z0x0 y0 z1...- N = nx * ny * nz
-
Unstructured Grid
DATASET UNSTRUCTUREDGRID POINTS ndataType x0 y0 z0...x(n-1) y(n-1) z(n-1)CELLS n sizenbpoints0 i0 j0 k0 l0 ...nbpoints1 i1 j1 k1 l1 ......CELL_TYPES ntype0type1...typen- The unstructured grid is defined by mesh points (POINTS), cells (CELLS) and cell types (CELL_TYPES).
- CELLS = n number of cells and size size of the list of cell coordinates (number of values to represent the list of nbpoints which define the coordinate points of each cell).
- nbpoints = number of coordinate points to define a cell
- CELL_TYPES = n number of cells
- type = cell type (line, triangle, quadrilateral...)
-
Polygonal Data
DATASET POLYDATAPOINTS nb_points dataTypex0 y0 z0x1 y1 z1...x(n-1) y(n-1) z(n-1)VERTICES nb_sommets sizenbPoints0,i0, j0, k0, ...nbPoints1,i1, j1, k1, ......nbPoints(n-1), i(n-1), j(n-1), k(n-1), ...LINES nb_lignes size idem ...POLYGONS nb_Polygons size idem ...TRIANGLE_STRIPS nb_triangles sizenbPoints0, i0, j0, k0,nbPoints1, i1, j1, k1,...nbPoints(n-1), i(n-1), j(n-1), k(n-1), ...- Polygonal data can be triangles, polygons, lines or vertices (VERTICES) and consist, for each type, of a list of (numbers of) points.
- n = total number of points
- dataType = float or int
- size = total number of values to read for each type (vertices, lines, polygons or triangles)
- nbPoints0 = number of vertices of the polygon (vertex, line, triangle)
Attribute Description
The attributes (values) associated with a geometry are identified by a dataName:
- Scalar Attributes
SCALARS dataName dataType [nb_Comp]LOOKUP_TABLE tableNames0s1...sn-1
- dataName = name (e.g. temperature, pressure,...)
- dataType = type float, int
- nb_comp is optional (number of components, =1 by default)
- tableName = name of the colour palette (default for the default palette)
- s1,s2,...,sn = the values.
- Vector Attributes
VECTORS dataName dataTypev0x v0y v0zv1x v1y v1z...v(n-1)x v(n-1)y v(n-1)z
- Normal Attributes
- Tensor Attributes
- Field Attributes
Examples
The following examples represent the same graph with different data structures.
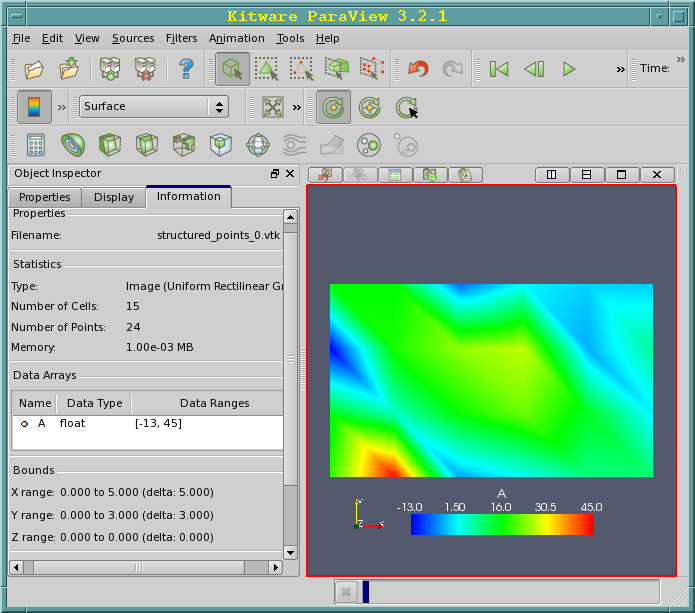
STRUCTURED_POINTS Example
# vtk DataFile Version 3.0
# Exemple STRUCTURED_POINTS
ASCII DATASET STRUCTURED_POINTS
DIMENSIONS 6 4 1
ORIGIN 0 0 0
SPACING 1 1 1
POINT_DATA 24
SCALARS A float
LOOKUP_TABLE default
 18.46
 45.00
 -3.51
 2.12
 8.65
 9.56
 14.11
 5.21
 16.44
 22.23
 13.95
 0.86
 -13.00
 17.34
 24.04
 26.91
 -2.98
 7.37
 15.80
 15.71
 -6.68
 1.44
 -1.05
 -1.40
STRUCTURED_GRID Example
# vtk DataFile Version 3.0
Exemple STRUCTURED_GRID
ASCII
DATASET STRUCTURED_GRID
DIMENSIONS 6 4 1
POINTS 24 float
 0 0 0
 1 0 0
 2 0 0
 3 0 0
 4 0 0
 5 0 0
 0 1 0
 1 1 0
 2 1 0
 3 1 0
 4 1 0
 5 1 0
 0 2 0
 1 2 0
 2 2 0
 3 2 0
 4 2 0
 5 2 0
 0 3 0
 1 3 0
 2 3 0
 3 3 0
 4 3 0
 5 3 0
POINT_DATA 24
SCALARS A float
LOOKUP_TABLE default
 18.46
 45.00
 -3.51
 2.12
 8.65
 9.56
 14.11
 5.21
 16.44
 22.23
 13.95
 0.86
 -13.00
 17.34
 24.04
 26.91
 -2.98
 7.37
 15.80
 15.71
 -6.68
 1.44
 -1.05
 -1.40
RECTILINEAR_GRID Example
# vtk DataFile Version 3.0
Exemple RECTILINEAR_GRID
ASCII
DATASET RECTILINEAR_GRID
DIMENSIONS 6 4 1
X_COORDINATES 6 float
0. 1. 2. 3. 4. 5.
Y_COORDINATES 4 float
0. 1. 2. 3
Z_COORDINATES 1 float
0.
POINT_DATA 24
SCALARS A float
LOOKUP_TABLE default
 18.46
 45.00
 -3.51
 2.12
 8.65
 9.56
 14.11
 5.21
 16.44
 22.23
 13.95
 0.86
 -13.00
 17.34
 24.04
 26.91
 -2.98
 7.37
 15.80
 15.71
 -6.68
 1.44
 -1.05
 -1.40
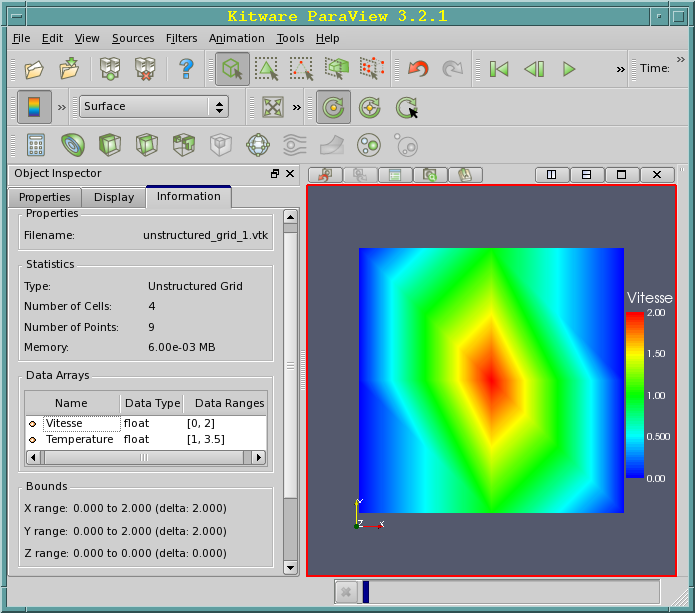
UNSTRUCTURED_GRID Example
# vtk DataFile Version 3.0
# Exemple UNSTRUCTURED_GRID
ASCII
DATASET UNSTRUCTURED_GRID
POINTS 9 FLOAT
0 0 0
0 1 0
0 2 0
1 2 0
1 1 0
1 0 0
2 0 0
2 1 0
2 2 0
CELLS 4 20 <-- Nb de cellules(4),taille de la liste(20)
4 0 5 4 1 <-- 4 points pour definir chaque cellule
4 1 4 3 2
4 5 6 7 4
4 4 7 8 3
CELL_TYPES 4 <-- 4 types de cellule
9 9 9 9 <-- Type de chaque cellule (9 = VTK_QUAD)
POINT_DATA 9 <-- Valeur des données aux points de la grille
SCALARS Vitesse float <-- 1er scalaire
LOOKUP_TABLE default <-- Table des couleurs par défaut pour le scalaire vitesse
0
0
0
1
2
1
0
0
SCALARS Temperature float <-- 2em scalaire
LOOKUP_TABLE default <-- Table des couleurs par défaut pour le scalaire temperature
1.2
2.1
2.5
3.5
1.3
1.4
1.6
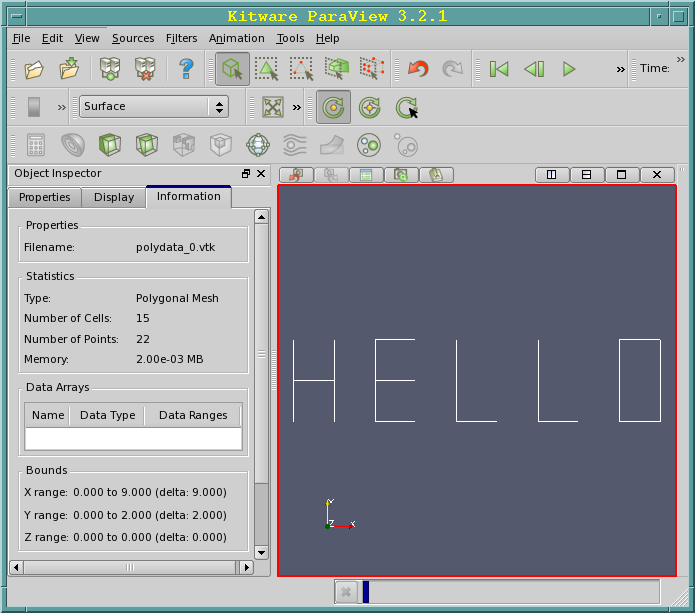
POLYDATA Example
# vtk DataFile Version 1.0
Exemple POLYDATA
ASCII
DATASET POLYDATA
POINTS 22 float
0. 0. 0.
0. 2. 0.
0. 1. 0.
1. 1. 0.
1. 0. 0.
1. 2. 0.
2. 0. 0.
3. 0. 0.
2. 2. 0.
3. 2. 0.
2. 1. 0.
3. 1. 0.
4. 0. 0.
5. 0. 0.
4. 2. 0.
6. 0. 0.
7. 0. 0.
6. 2. 0.
8. 0. 0.
9. 0. 0.
8. 2. 0.
9. 2. 0.

LINES 15 45
2 0 1
2 4 5
2 2 3
2 6 8
2 6 7
2 10 11
2 8 9
2 12 13
2 12 14
2 15 16
2 15 17
2 18 19
2 20 21
2 18 20
2 19 21
XML Formats
This format, which uses XML syntax (eXtensible Makup Language, successor
to HTML), has the following characteristics: - more difficult to use -
allows parallel I/O - portable compression of data. There are two types
of vtk XML file structures depending on whether the data is used
sequentially or in parallel. The files defined for parallel use are
divided into several parts, each process is attached to one or more
parts. A file of this type does not contain data but a description of
the data structure and links to the different sequential files. The
different data structures of the vtk simple legacy formats files are also
available for XML files.
Data structures and suffixes for sequential XML files:
- ImageData (.vti),
- RectilinearGrid (.vtr),
- StructuredGrid (.vts),
- UnstructuredGrid(.vtu),
- PolyData (.vtp),
Data structures and suffixes for parallel XML files:
- PImageData (.pvti),
- PRectilinearGrid (.pvtr),
- PStructuredGrid (.pvts).
- PUnstructuredGrid(.pvtu)
- PPolyData (.pvtp),
The general syntax is as follows:
 <VTKFile type=\?type\? version=\?0.1\?>

 ...

 </VTKFile>

type : un des précédents types (ImageData,RectilinearGrid,...)

version : File version number in \?major.minor\? format.
In each file you will find the description of the part represented (Piece Extent) as well as the whole area to be represented (WholeExtent)
Sequential XML File Structure
-
ImageData
<VTKFile type="ImageData" ...><ImageData WholeExtent="x1 x2 y1 y2 z1 z2"Origin="x0 y0 z0" Spacing="dx dy dz"><Piece Extent="x1 x2 y1 y2 z1 z2"><PointData>...</PointData><CellData>...</CellData></Piece></ImageData></VTKFile> -
RectilinearGrid
<VTKFile type="RectilinearGrid" ...><RectilinearGrid WholeExtent="x1 x2 y1 y2 z1 z2"><Piece Extent="x1 x2 y1 y2 z1 z2"><PointData>...</PointData><CellData>...</CellData><Coordinates>...</Coordinates></Piece></RectilinearGrid></VTKFile> -
StructuredGrid
<VTKFile type="StructuredGrid" ...><StructuredGrid WholeExtent="x1 x2 y1 y2 z1 z2"><Piece Extent="x1 x2 y1 y2 z1 z2"><PointData>...</PointData><CellData>...</CellData><Points>...</Points></Piece></StructuredGrid></VTKFile> -
UnstructuredGrid
<VTKFile type="UnstructuredGrid" ...><UnstructuredGrid><Piece NumberOfPoints="#" NumberOfCells="#"><PointData>...</PointData><CellData>...</CellData><Points>...</Points><Cells>...</Cells></Piece></UnstructuredGrid></VTKFile> -
PolyData
<VTKFile type="PolyData" ...><PolyData><Piece NumberOfPoints="#" NumberOfVerts="#" NumberOfLines="#"NumberOfStrips="#" NumberOfPolys="#"><PointData>...</PointData><CellData>...</CellData><Points>...</Points><Verts>...</Verts><Lines>...</Lines><Strips>...</Strips><Polys>...</Polys></Piece>14 VTK 4.2 File Formats</PolyData></VTKFile>
Parallel XML File Structure
-
PImageData
<VTKFile type="PImageData" ...><PImageData WholeExtent="x1 x2 y1 y2 z1 z2"GhostLevel="#" Origin="x0 y0 z0" Spacing="dx dy dz"><PPointData>...</PPointData><PCellData>...</PCellData><Piece Extent="x1 x2 y1 y2 z1 z2" Source="imageData0.vti"/>...</PImageData></VTKFile> -
PRectilinearGrid
<VTKFile type="PRectilinearGrid" ...><PRectilinearGrid WholeExtent="x1 x2 y1 y2 z1 z2"GhostLevel="#"><PPointData>...</PPointData><PCellData>...</PCellData><PCoordinates>...</PCoordinates><Piece Extent="x1 x2 y1 y2 z1 z2"Source="rectilinearGrid0.vtr"/>...</PRectilinearGrid></VTKFile> -
PStructuredGrid
<VTKFile type="PStructuredGrid" ...><PStructuredGrid WholeExtent="x1 x2 y1 y2 z1 z2"GhostLevel="#"><PPointData>...</PPointData><PCellData>...</PCellData><PPoints>...</PPoints><Piece Extent="x1 x2 y1 y2 z1 z2"Source="structuredGrid0.vts"/>...</PStructuredGrid></VTKFile> -
PUnstructuredGrid
<VTKFile type="PUnstructuredGrid" ...><PUnstructuredGrid GhostLevel="0"><PPointData>...</PPointData><PCellData>...</PCellData><PPoints>...</PPoints><Piece Source="unstructuredGrid0.vtu"/>...</PUnstructuredGrid></VTKFile> -
PPolyData
<VTKFile type="PPolyData" ...><PPolyData GhostLevel="#"><PPointData>...</PPointData><PCellData>...</PCellData><PPoints>...</PPoints><Piece Source="polyData0.vtp"/>...</PPolyData></VTKFile>
Documentation
The HELP menu of ParaView offers a large number of explanations on the available functions.
The documentation of ParaView is available online: https://docs.paraview.org/en/latest/.