Profiling of TensorFlow Applications
This page was translated by an AI (LLM) with a cursory human check and is awaiting full review.
TensorFlow integrates the TensorFlow Profiler functionality.
The TensorFlow Profiler requires TensorFlow and TensorBoard versions 2.2 or higher. On Jean Zay, it is available under TensorFlow versions 2.2.0 and higher by loading the appropriate module. For example:
module load tensorflow-gpu/py3/2.2.0
Instrumenting TensorFlow code for profiling
To generate TensorBoard logs in the appropriate format as output from your TensorFlow application, you need to:
- create a TensorBoard callback to capture metrics. Here, profiling will be done between iterations 2 and 12:
# Create a TensorBoard callback
logs = "logs/" + datetime.now().strftime("%Y%m%d-%H%M%S")

tboard_callback = tf.keras.callbacks.TensorBoard(log_dir = logs,
                                                 histogram_freq = 1,
                                                 profile_batch = (2,12))
- call it during model training:
# Train model
model.fit(ds_train,
         epochs=2,
         validation_data=ds_test,
         callbacks = [tboard_callback])
Visualising the profile with TensorBoard
The visualisation of TensorFlow Profiler results is possible via TensorBoard, in the PROFILE tab. Access to TensorBoard on Jean Zay is documented here. You can also visualise your logs by downloading them to your local machine.
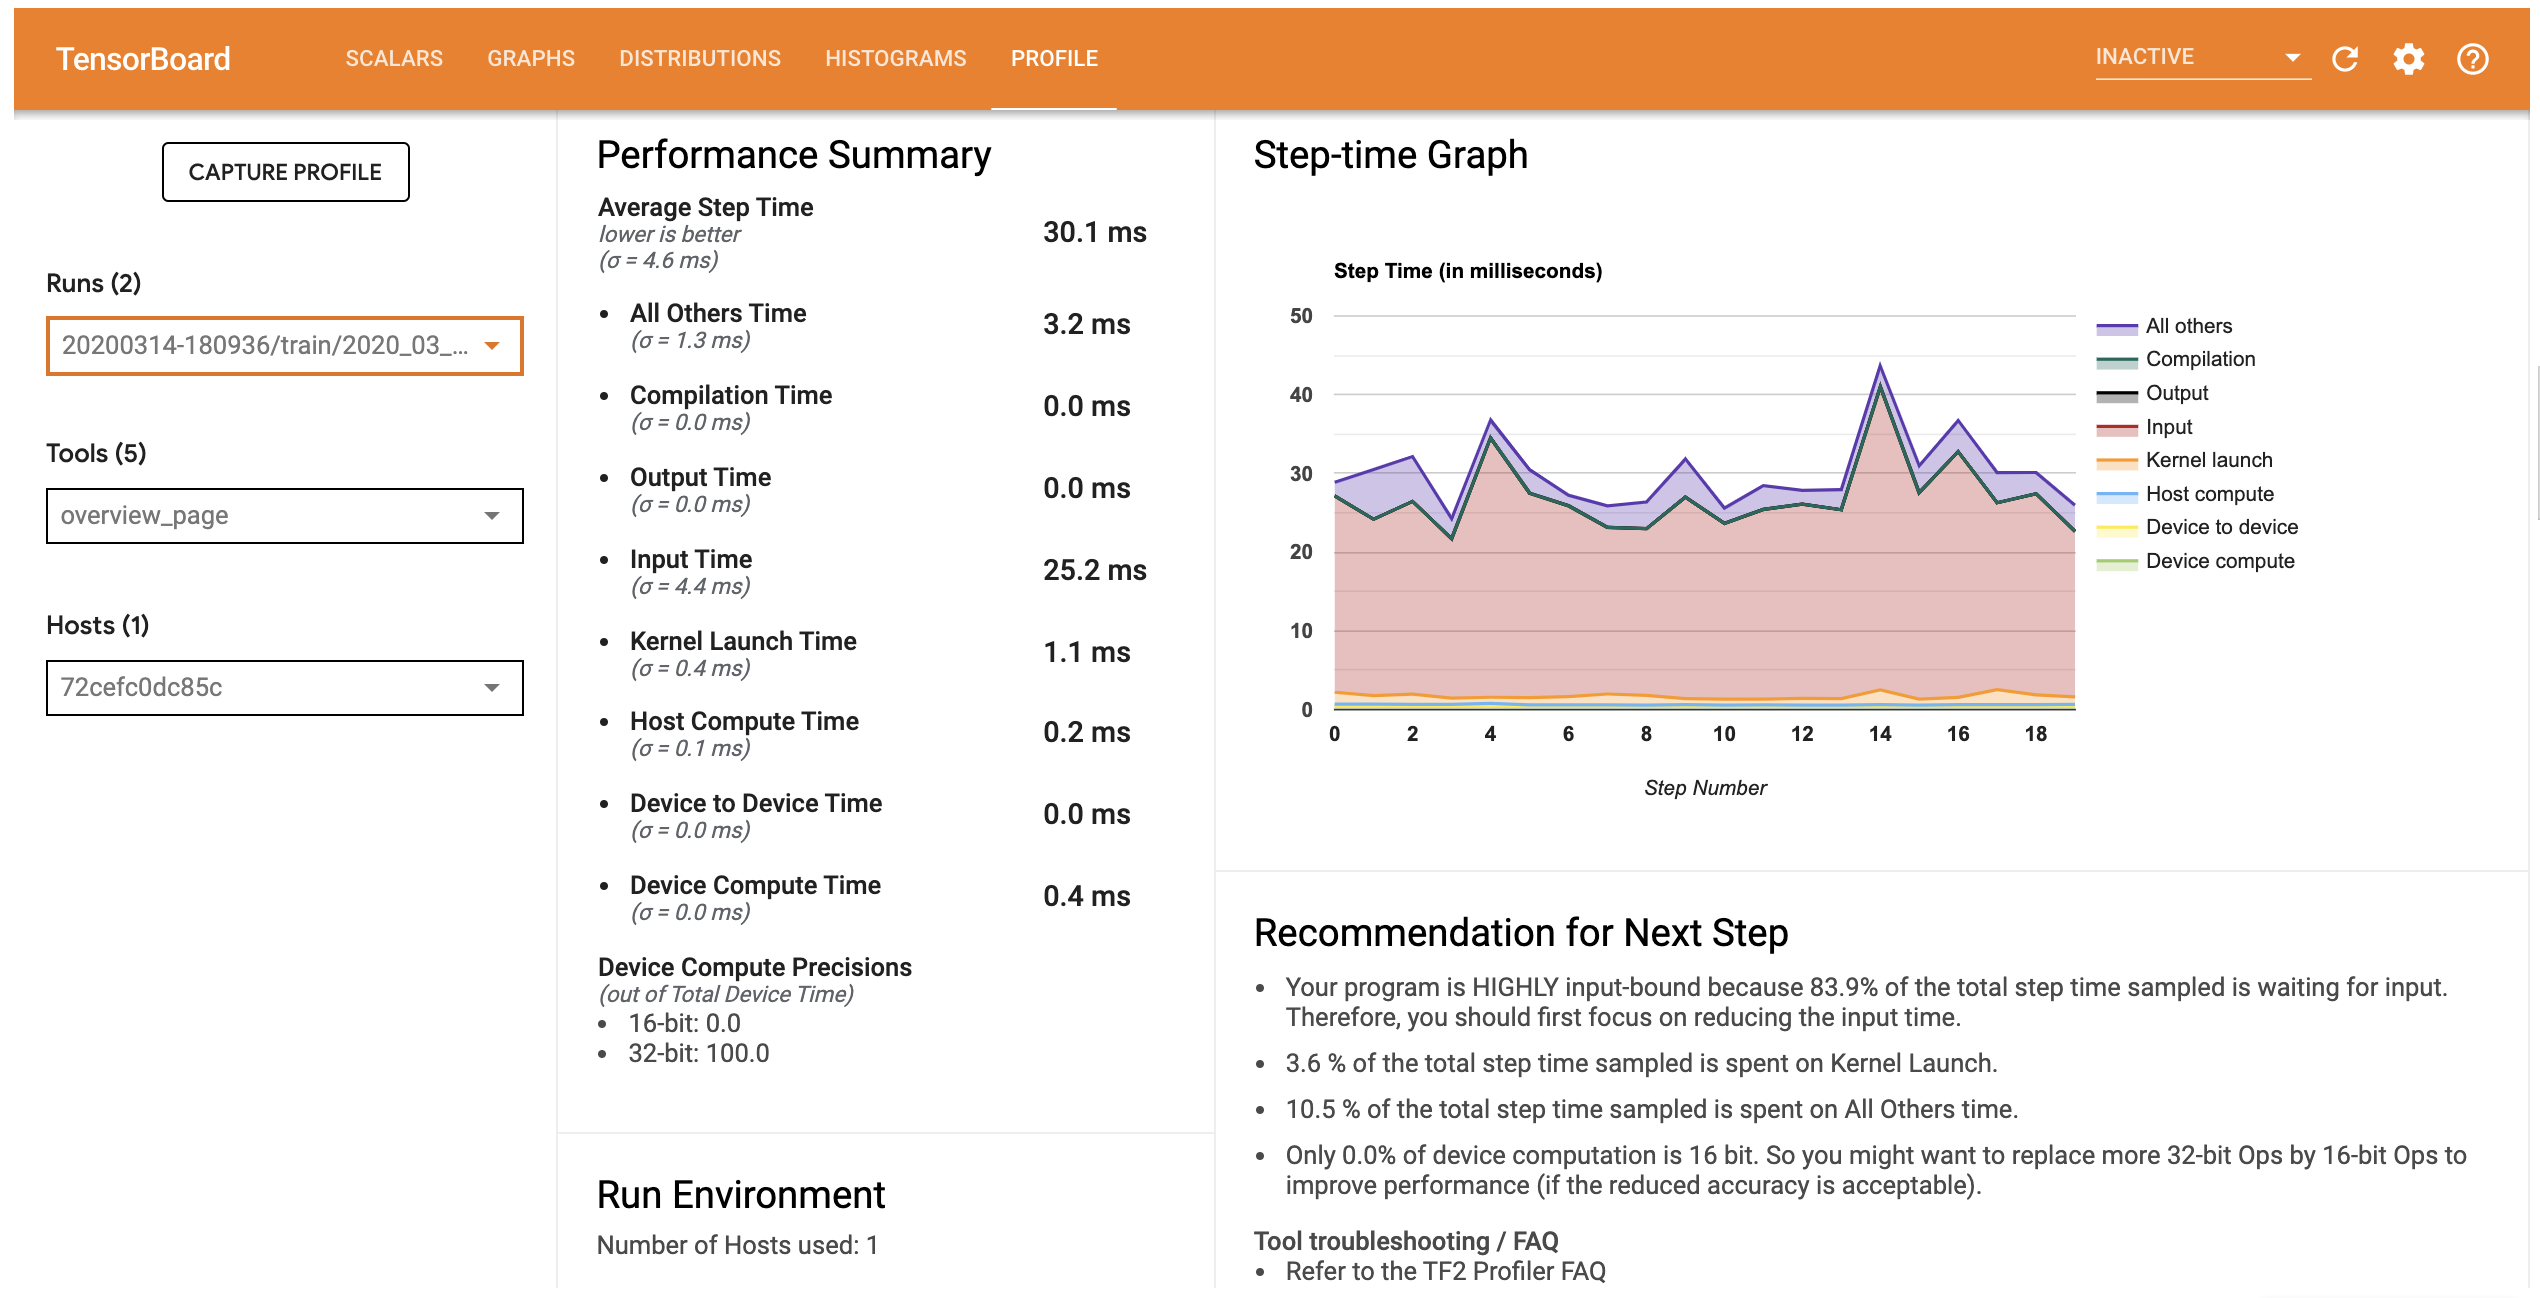
The PROFILE tab of TensorBoard opens on the Overview Page. It provides a summary of the runtime performance of the different computation steps. This allows you to quickly see which of the learning, data loading or data preprocessing is the most time-consuming.
Overview Page of the PROFILE tab
Then the Trace Viewer page provides a more detailed view of the sequence of executions, distinguishing between operations executed on GPU and on CPU. For example:
Trace Viewer Page of the PROFILE tab
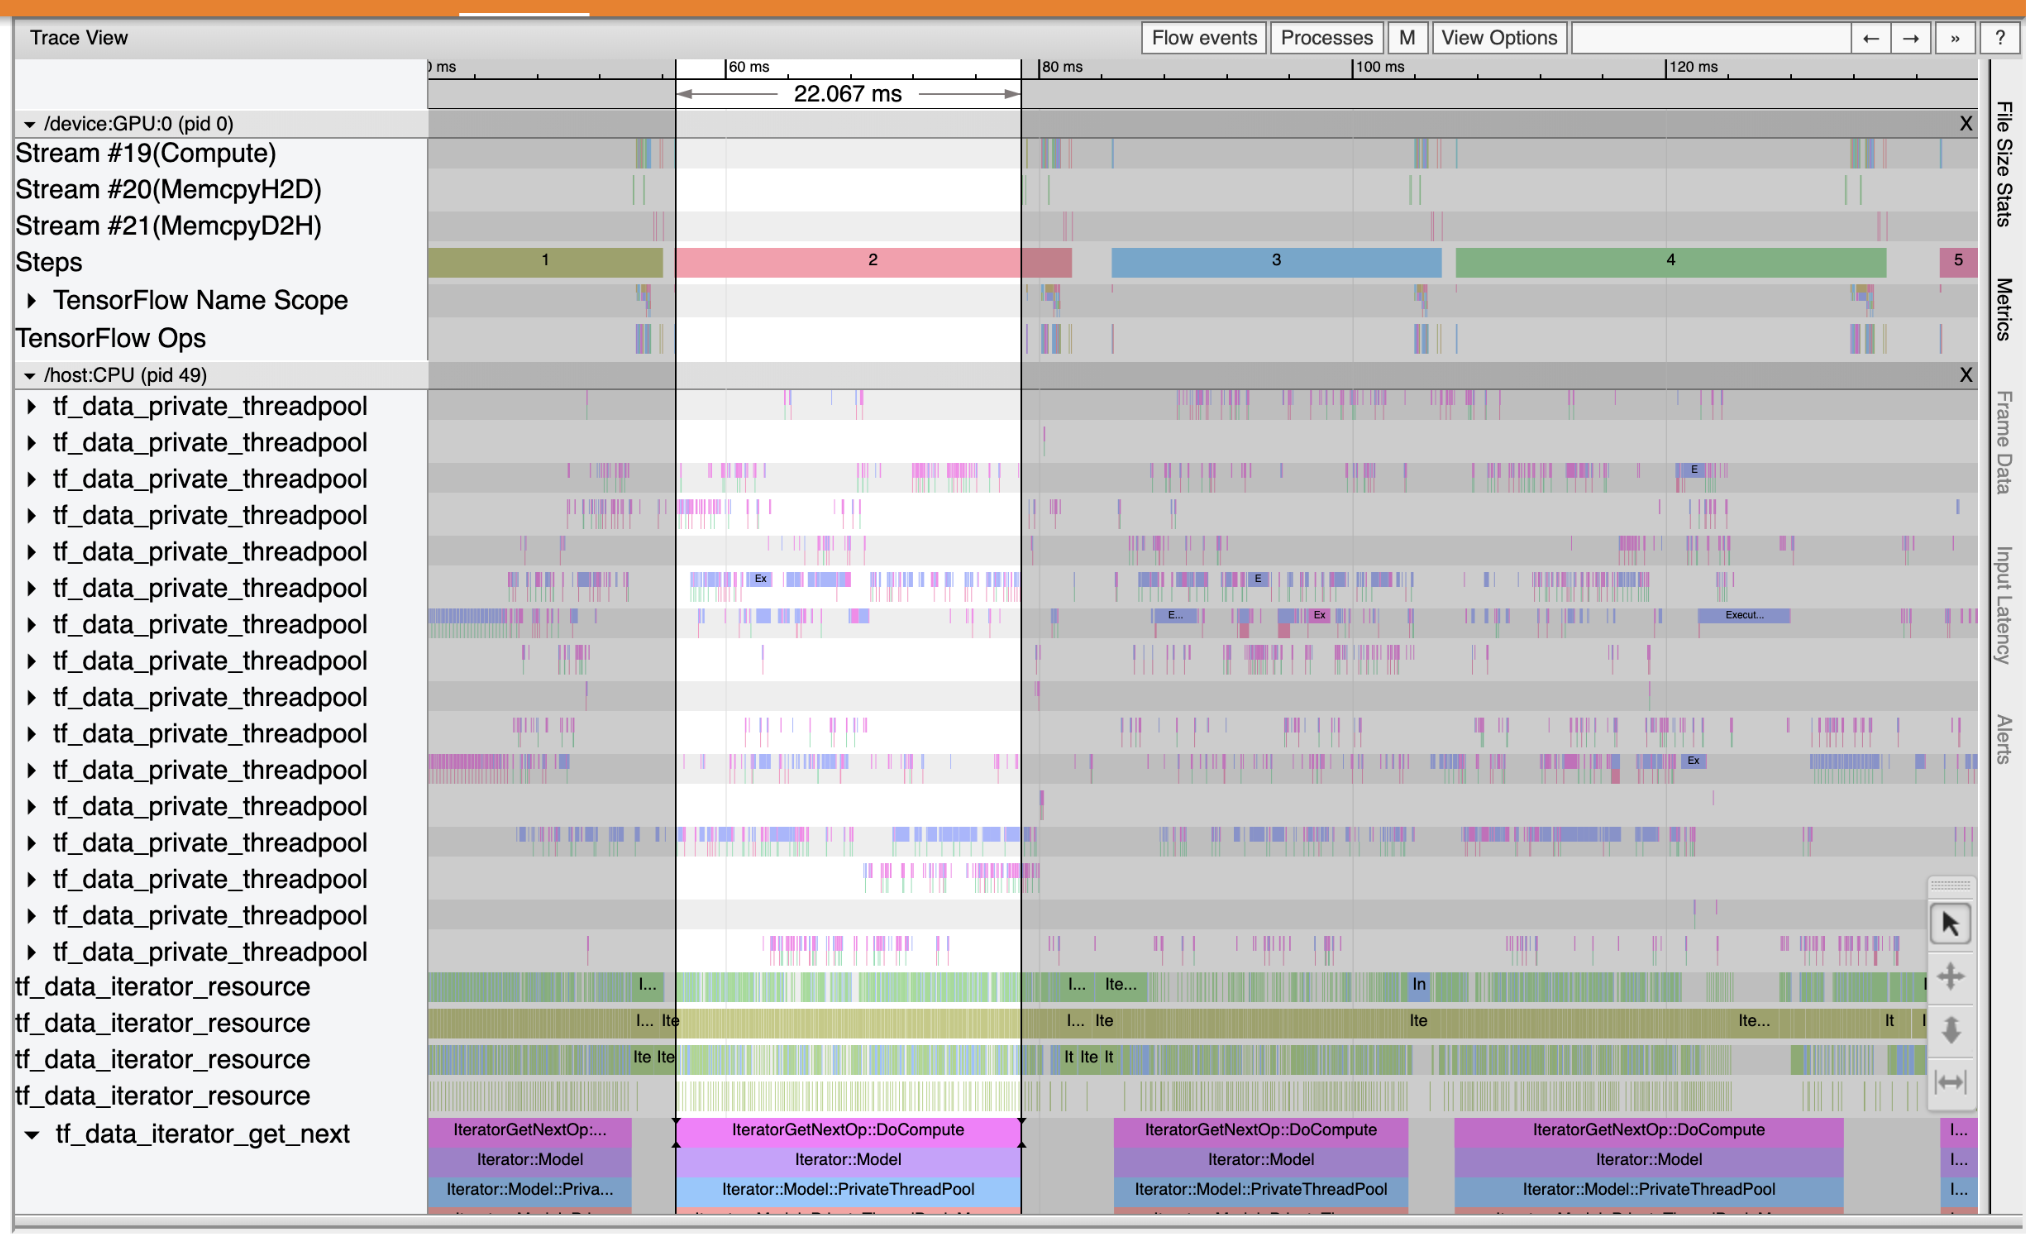
In this example, we can see that the GPU (at the top) is underutilised compared to the CPU (at the bottom) most of the time. The coloured blocks show that the GPU is only used at the end of the steps, while the CPU is used regularly on certain threads. Optimisation is certainly possible by better distributing the work between GPU and CPU.