This page was translated by an AI (LLM) with a cursory human check and is awaiting full review.
Jean Zay: Using DLProf with PyTorch
DLProf is a profiling tool provided by NVIDIA and dedicated to Deep Learning. It is based on the Nsight Systems tool, also developed by NVIDIA. DLProf, through Nsight Systems, collects and records the instructions executed by the different GPUs.
The application dlprofviewer serves as an interface between the log files generated by DLProf and the dashboard from which the various reports of the tool can be viewed.
Availability on Jean Zay
On Jean Zay, the DLProf tool is available in the PyTorch modules starting from version pytorch-gpu/py3/1.8.1.
You can load one of our modules by running, for example:
module load pytorch-gpu/py3/1.9.0
The latest release of DLProf is based on PyTorch 1.11. It is not guaranteed that DLProf will still work on more recent versions of PyTorch.
Implementation of DLProf
To make DLProf work in your code, you need to add a few lines of code.
In the Python script
First, you need to load the plugin and initialise it:
import nvidia_dlprof_pytorch_nvtx as dlprof
dlprof.init()
Then, you need to run the training loop in the emit_nvtx context of PyTorch. This context will collect values for the Nsight Systems report.
with torch.autograd.profiler.emit_nvtx():
    for epoch in range(2):
        for i, (texts, labels) in enumerate(train_loader):
            ...
In the Slurm script
As with Nsight, you should avoid overloading the system directory /tmp which is used by default (very small space on the compute nodes). To do this, you need to ensure that the temporary files are placed in the space called $JOBSCRATCH.
Sequential
If your code runs on a single process, you can use the following instructions in your launch script to use DLProf:
export TMPDIR=$JOBSCRATCH
ln -s $JOBSCRATCH /tmp/nvidia

srun dlprof --mode pytorch python script.py
Parallel
With the above instructions, when multiple processes are used (in multi-GPU with one process per GPU), all DLProf processes will try to write to a single file, which will then be corrupted. To overcome this problem, you need to specify a different output file for each process.
Additionally, if you are working in a multi-node environment, you need to create a different temporary directory TMPDIR for each node.
An example of a working command:
srun bash -c 'export TMPDIR=${JOBSCRATCH}/${SLURM_PROCID};\
              mkdir -p ${TMPDIR}/tmp;\
              ln -s ${TMPDIR}/tmp /tmp/nvidia;\
              dlprof -m pytorch\
              --output_path ./${SLURM_PROCID}\
              --nsys_base_name nsys_${SLURM_PROCID}\
              --profile_name dlprof_rank${SLURM_PROCID}\
              python script.py'
You will get one log file per process.
Visualisation with DLProf Viewer
The DLProf log files (dlprof_dldb.sqlite) must be downloaded to your personal machine to be viewed via a local installation of DLProf Viewer. All necessary information for use and installation is available in the official NVIDIA documentation: DLProf Viewer User Guide.
You will need to choose a version of DLProf Viewer that is compatible with the version of PyTorch used at runtime.
The visualisation dashboard is simply displayed by opening the correct log file with the command:
dlprofviewer dlprof_dldb.sqlite
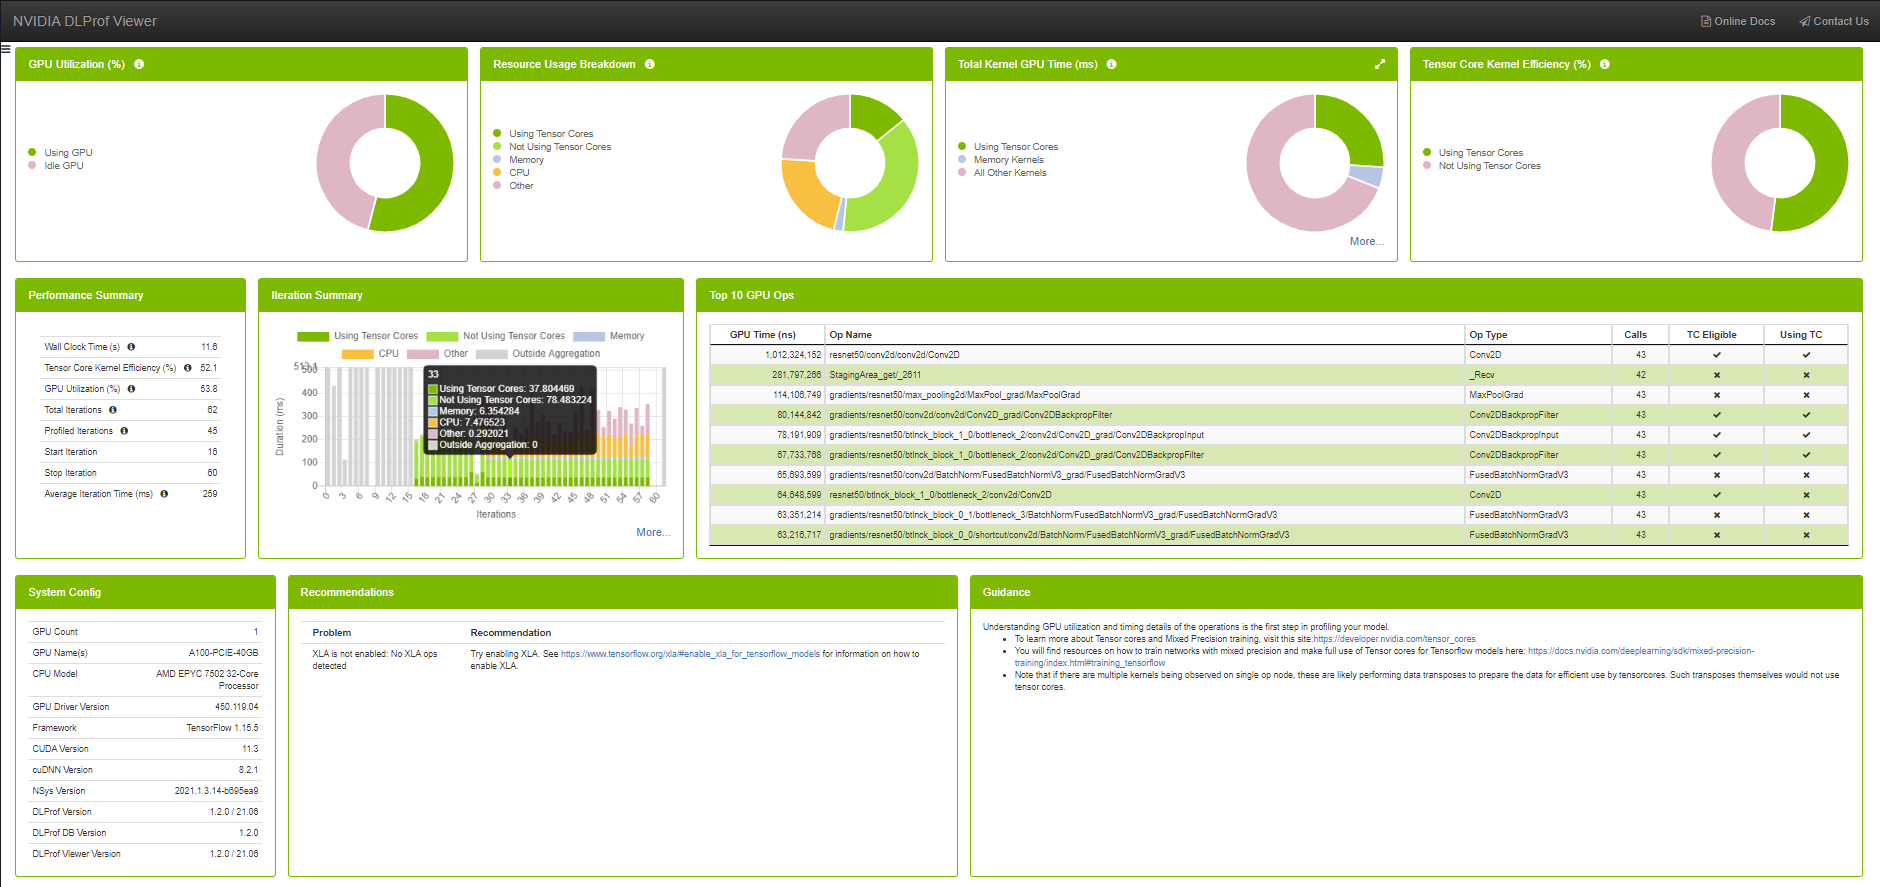
DLProf Dashboard
Visualisation of the Timeline with the Nsight Systems tool
To view the timelines, you need to open the Nsight Systems reports generated by dlprof.
To do this, you need to:
- connect to Jean Zay with the graphical option (forwarding X11) enabled
:
ssh -X <login_jean-zay>@jean-zay.idris.fr - load a module containing the correct version of Nsight Systems,
for example:
module load nvidia-nsight-systems/2021.2.1 - open the trace file with the Nsight Systems graphical tool, for
example:
nsys-ui nsys_0.qdrep
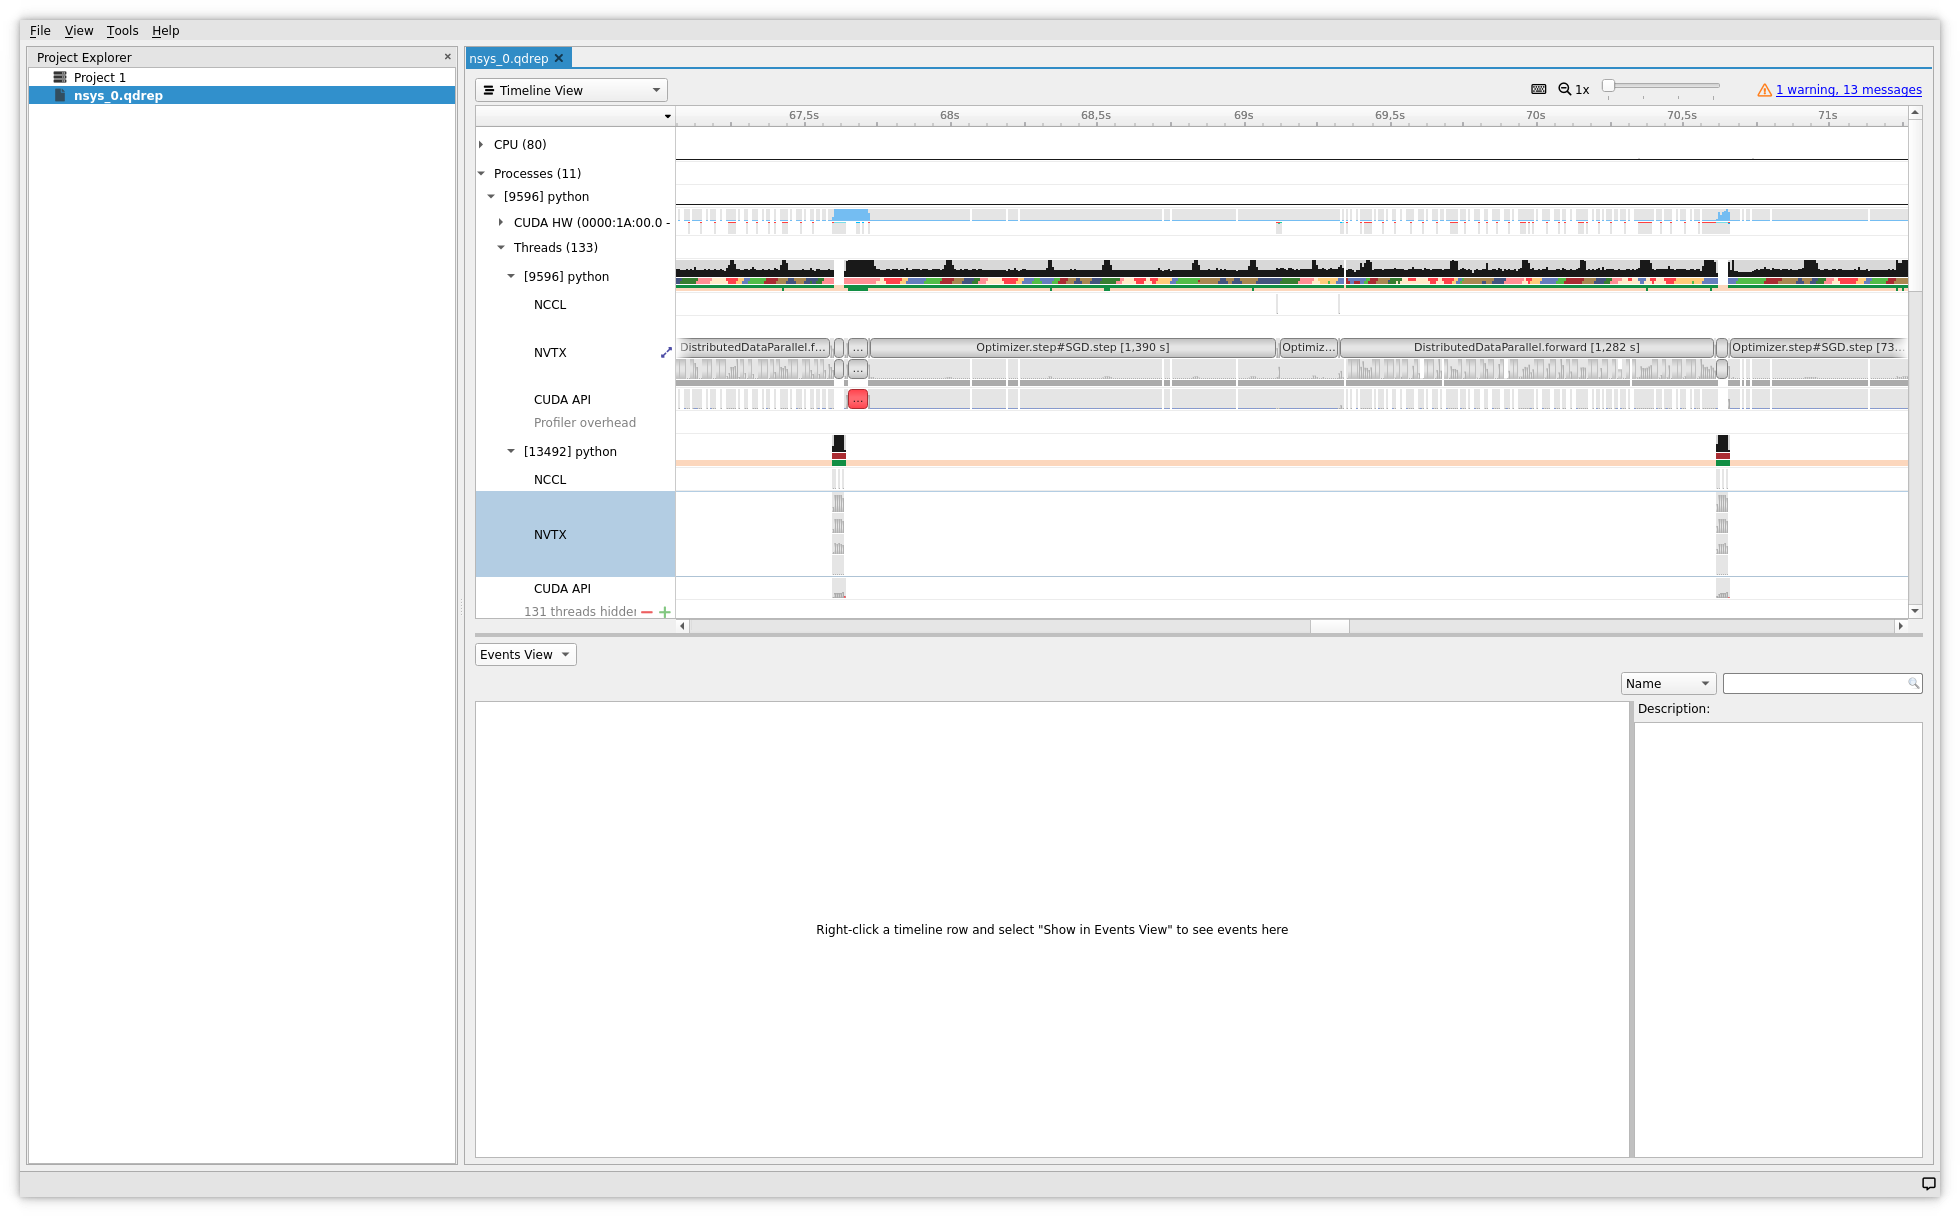
Nsight Systems Visualisation
Proper use of the profiler
In case the profiler drastically slows down the training, causes out of memory errors or other errors due to the overhead of operations it generates, it is advisable to reduce the number of iterations (for example to 50, or even 10), with the commands --iter_start and --iter_stop (see the documentation DLProf User Guide), and/or to reduce the size of the dataset.
The profiler is not intended to be used during a full training session.
Official documentation
- Documentation DLProf User Guide
- Documentation DLProf Viewer User Guide