Table des matières
Jean Zay : Arm DDT
Introduction
DDT is a graphical parallel debugger which can be used for debugging CPU (OpenMP, MPI) and GPU (CUDA, OpenACC) applications and (MPI+CUDA, MPI+OpenACC) hybrid applications.
Compilation
Your program must be compiled with the -g option. This compilation option keeps useful information for debuggers in the executable file (source code line numbers, names of variables, …).
For debugging CUDA codes, you need to add the -G option of the NVIDIA compiler nvcc to write necessary information about the GPU kernels into the executable file.
For more information, you may consult the detailed list of debugging options of Intel compilers.
Usage
The DDT debugger is accessed via the module command:
$ module load arm-forge
Important: The DDT graphical interface can only be used on the Jean Zay front-end nodes. Moreover, its usage requires that your connection authorise the graphical XWindows display (for example, with the -X option of the ssh command).
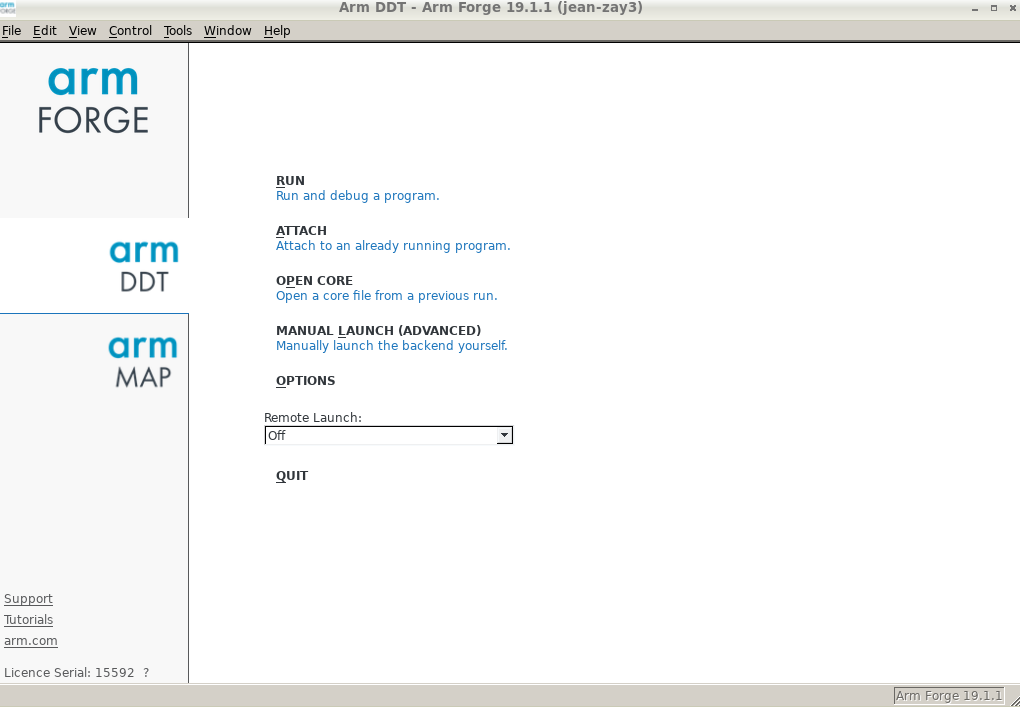
After DDT is launched via the following command,
$ ddt&
a window should appear on your screen, such as:
Reverse Connect Mode
The DDT graphical interface cannot be run on the compute nodes. Therefore, we recommend using the DDT Reverse Connect functionality by following these two steps:
- Create or modify your submission script in order to use DDT in Reverse Connect mode:
- intel_mpi_debug.slurm
# Your usual Slurm directives
...
# Load the usual modules
...
# Add the arm-forge module for DDT
module load arm-forge

# Echo of launched commands
set -x

# Execution of the code via DDT in Reverse Connect mode.
ddt --connect srun ./exec_mpi_to_debug
Comment: In certain cases (for example, with codes not using the MPI library), it could be necessary to set the following environment variables in your script:
export ALLINEA_MPI_INIT=main
export ALLINEA_HOLD_MPI_INIT=1
Or, if the above variables do not function:
export ALLINEA_STOP_AT_MAIN=1 - Next, from your interactive session, run the DDT graphical interface in the background (note the symbole
&at the end of the commandddt&). Then, when the graphical interface window is displayed on your screen, submit your Slurm job:$ module load arm-forge $ ddt& $ sbatch intel_mpi_debug.slurm
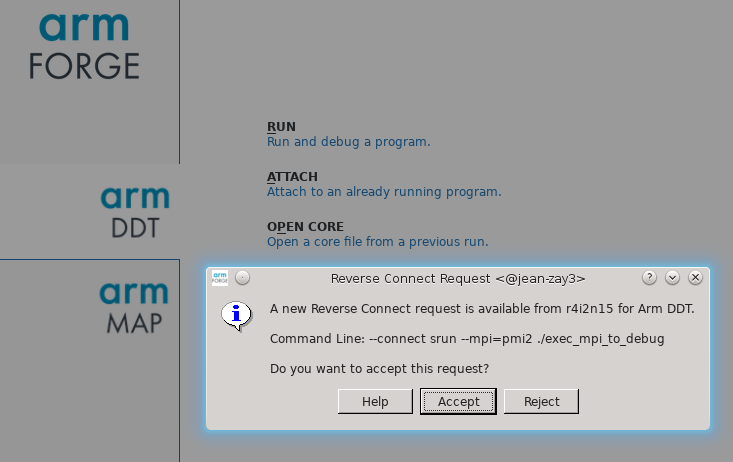
Important: When your job executes the
ddt --connect ...command, DDT will display a “Reverse Connect Request” which you should accept before clicking onRunto launch your code execution. On your screen, the display should look like this:
Specificities for the GPU codes
You can encounter certain debugging difficulties with GPU codes if they were written using high-level programming models such as OpenACC.
To launch DDT on GPU codes, the ALLINEA_FORCE_CUDA_VERSION variable corresponding to the CUDA version used must be set: See the output of the module list command to know the version used.
For example, with CUDA 9.2:
$ module load cuda
$ module list
Currently Loaded Modulefiles:
  1) cuda/9.2
$ export ALLINEA_FORCE_CUDA_VERSION=9.2
$ ddt&
Important: After DDT is connected to your SLURM job, make sure that the CUDA debugging is activated before starting the code execution. If you wish, memory debugging can also be activated (as shown below).
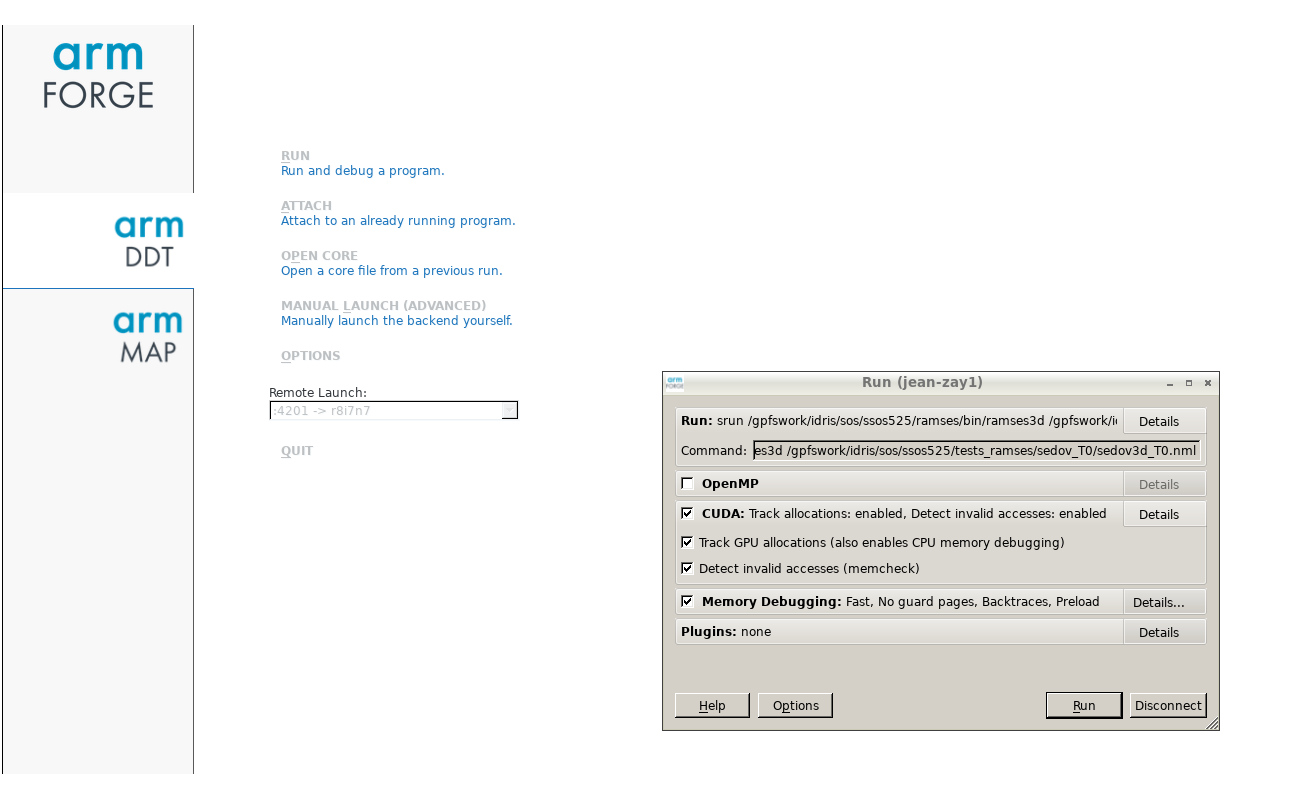
Comment: By default, DDT will stop at the launching of each GPU kernel. This behaviour can be changed on the Control/Default Breakpoints menu.
Documentation
DDT documentation is available on the Arm Web site.
Licence
IDRIS has a licence with 8196 tokens which are shared by two ARM products: DDT and MAP; one token is needed for each MPI process.