

Table des matières
Jean Zay : Arm MAP
MAP is a graphical performance analysis tool for parallel applications on CPU (OpenMP, MPI), GPU (CUDA C/C++/Fortran, OpenACC) and hybrid applications (MPI+CUDA/OpenACC).
Compilation
Your program must be compiled with the -g option of Intel and GNU compilers. This option instructs the compiler to add various information to the executable file to display the line numbers of the source code, the variable names, etc.
For more information, you may consult the detailed list in Debugging options of Intel compilers.
Utilisation
The Arm Forge DDT debugger and MAP profiler have a common graphical interface. You can use the ARM Forge graphical interface installed on Jean Zay or one which is installed locally on your machine (called « Arm Remote Client »).
Arm Forge GUI on Jean Zay
The Arm Forge graphical interface installed on Jean Zay is accessible via the command module:
$ module load arm-forge
Important: The Arm Forge graphical interface can only be used on the frontal nodes of Jean Zay. In addition, its usage requires that your connection authorises the Xwindows graphical display (for example, with the -X option of the ssh command).
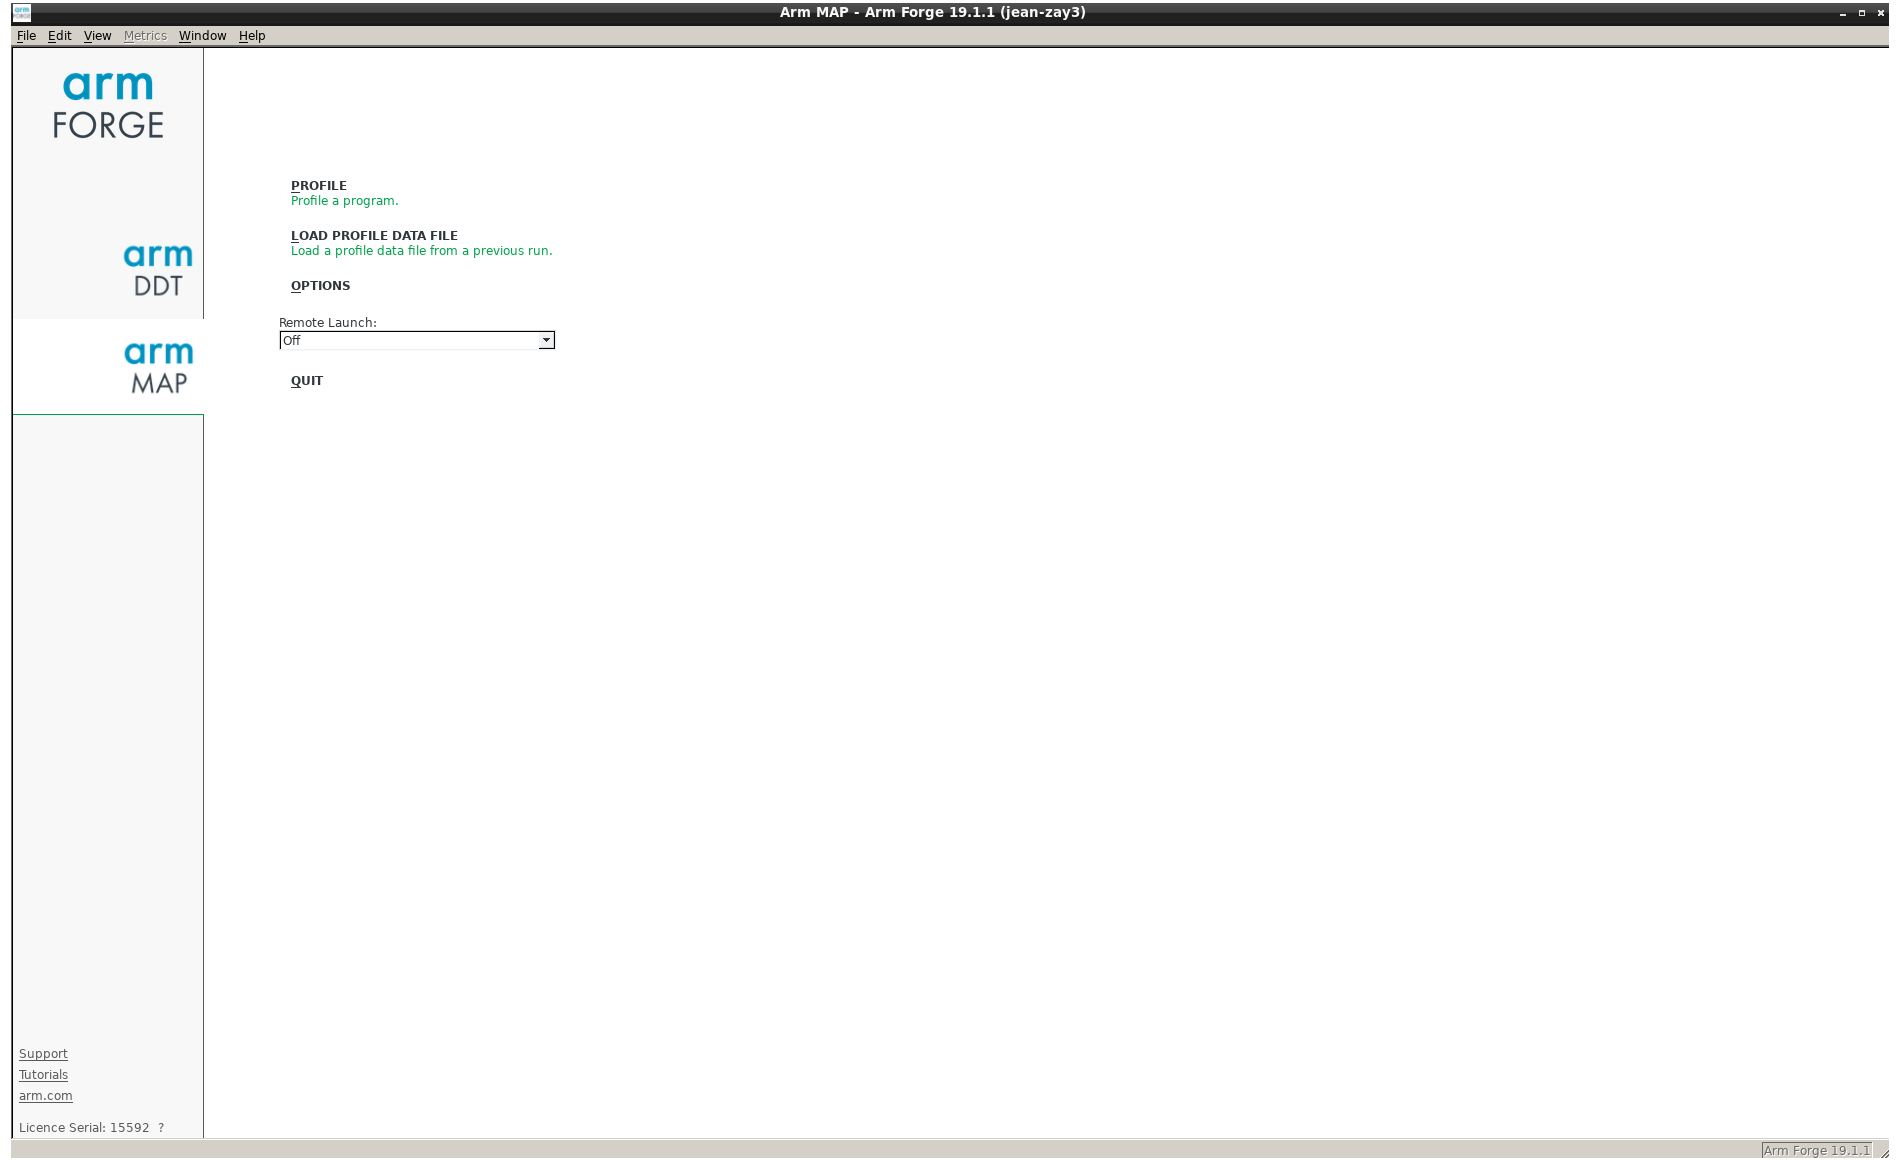
Once MAP has been launched with the following command,
$ map&
a window such as this should appear on your screen :
Arm Forge GUI installed locally (Arm Remote Client)
Alternatively, it is possible to use the graphical interface (Arm Remote Client) installed locally on your machine. This allows avoiding the Xwindows graphical display through the ssh connection and thus offer a better interface response time if your network is inefficient.
Arm Remote Client can be downloaded free of charge on the Arm site.
Important: The Remote Client version must correspond to the version of the Arm Forge package installed on Jean Zay. This version number is indicated by the map -v command:
$ module load arm-forge
$ map -v
Arm MAP
Part of Arm Forge.
Copyright (c) 2002-2019 Arm Limited (or its affiliates). All rights reserved.

Version: ...
At the first launching of Arm Remote Client, it is necessary to establish a connection to Jean Zay via Remote Launch/Configure/Add. In the field Remote Installation Directory, you should indicate the installation directory of Arm Forge on Jean Zay; you may find this with the following command:
$ module display arm-forge
...
prepend-path PATH /path/to/install/arm/arm-forge-version/bin
...
In the output of this command, you will see that the PATH variable is completed by the character chain /path/to/install/arm/arm-forge-version/bin which shows that the installation directory is /path/to/install/arm/arm-forge-version (without the suffix /bin).
For more information about the Arm Remote Client, you may consult the section « Connecting to a remote system » in the Arm documentation.
Profiling a code
There are two ways to profile a code with MAP:
- Executing the code in the command line in your Slurm job and viewing the results a posteriori with the Arm Forge graphical interface,
or
- Executing the code directly via Arm Forge graphical interface with the Reverse Connect functionality.
Profiling a code in the command line
To profile your code in the command line, add the map command with the option --profile at the beginning of the execution line (before the srun command):
- intel_mpi_map.slurm
# Your usual Slurm directives
...
#  Load the usual modules
...
# Add the MAP arm-forge module
module load arm-forge

# Echo of launched commands
set -x

# Avoid saturating the temporary directory /tmp
export TMPDIR=$JOBSCRATCH

# Code execution
map --profile srun ./exec_mpi_to_profile
After executing the code, a .map file will be generated in your execution directory.
Important: If the execution is done in the JOBSCRATCH temporary directory, the .map file will be automatically deleted. Therefore, you need to remember to copy it into another directory at the end of the job.
To view it, launch the graphical interface either locally on your machine or on Jean Zay, then click on Load Profile Data File and choose the .map file which was just generated.
Profiling a code via the graphical interface
The second way to profile with MAP is to use its Reverse Connect functionality by following the two steps below:
- Create or modify your submission script in order to use MAP in Reverse Connect mode (option
--connectof themapcommand):#!/bin/bash # Your usual Slurm directives ... # Load the usual modules module purge module load ... # Add the MAP arm-forge module module load arm-forge # Echo of launched commands set -x # Avoid saturating the temporary directory /tmp export TMPDIR=$JOBSCRATCH # Code execution map --connect srun ...
Comment: In certain cases (for example, with codes which do not use the MPI library), it could be necessary to set the following environment variables in your script:
export ALLINEA_MPI_INIT=main
export ALLINEA_HOLD_MPI_INIT=1
or, if they do not function,
export ALLINEA_STOP_AT_MAIN=1 - For the second step, from your interactive session on Jean Zay or on your local machine (Arm Remote Client) launch the MAP graphical interface (in this example, it is in the background via the
&symbol at the end of the commandmap&) then, when the interface is displayed on your screen, submit your Slurm job:$ module load arm-forge $ map& $ sbatch intel_mpi.slurm
Important: When your job executes the
map --connect ...command, MAP will display a connection request that you must accept before clicking onRunto launch your code execution.
Documentation
MAP documentation is available on the Arm Web site.
Licence
IDRIS has a licence with a total of 8196 tokens which are shared by the two ARM products, DDT and MAP: Using them requires one token for each MPI process.