

Table des matières
Jean Zay: Nsight-based profiler DLProf with PyTorch
DLProf is a profiling tool provided by Nvidia and dedicated to Deep Learning. It is based on the Nsight tool, also developed by Nvidia, which is a low level profiler. Through Nsight, DLProf gathers and saves the instructions launched to the different GPU kernels. The dlprofviewer application serves as interface between the DLProf log files and the dashboard, in which we can view the different reports of the tool.
For more information about Nsight, you may see the following document: Nsight Systems
Installation and Libraries
On Jean Zay, the DLProf tool is installed in the IDRIS modules beginning with the version pytorch-gpu/py3/1.8.1.
Here is a functioning example:
module load pytorch-gpu/py3/1.9.0
Implementing DLProf
In order for DLProf to work in your code, you must add some code lines.
In the python script
With nvidia-dlprof-pytorch-nvtx
First of all, you need to load the plugin and initialize it:
import nvidia_dlprof_pytorch_nvtx as dlprof
dlprof.init()
Then you need to launch the training loop in the Pytorch emit_nvtx context. This context will collect the values for the Nsight report.
with torch.autograd.profiler.emit_nvtx():
    for epoch in range(2):
        for i, (texts, labels) in enumerate(train_loader):
            ...
In the sbatch script
In the same way as with Nsight, to avoid overloading the /tmp dossier, you need to force the temporary files to use the space called $JOBSCRATCH.
If using only one process
In this case, you can use DLprof in your launching script this way:
export TMPDIR=$JOBSCRATCH
ln -s $JOBSCRATCH /tmp/nvidia

srun dlprof --mode pytorch python script.py
Multiple processes
Si plusieurs processus sont utilisés (en multi-GPU avec un processus par GPU), il faut spécifier un fichier de sortie différent par processus. En effet, DLProf cherchera par défaut à écrire dans le même fichier depuis chaque processus, ce qui corrompra ce fichier.
Pour la même raison, il faut définir un espace TMPDIR différent pour chaque processus.
If multiple processes are used (in multi-GPUs with one process per GPU), it is necessary to specify a different output file for each process. Indeed DLProf will try by default to write everything in the same file, thereby corrupting it.
For the same reason, it is necessary to define a different TMPDIR for each process.
The following is an example of a functional command (a little long but has the advantage of functioning in every case):
srun bash -c 'export TMPDIR=${JOBSCRATCH}${SLURM_PROCID};\
              mkdir -p ${TMPDIR}/tmp;\
              ln -s ${TMPDIR}/tmp /tmp/nvidia;\
              dlprof -m pytorch\
              --output_path ./${SLURM_PROCID}\
              --nsys_base_name nsys_${SLURM_PROCID}\
              --profile_name dlprof_rank${SLURM_PROCID}\
              python script.py'
Comment: You will then obtain a log file per process.
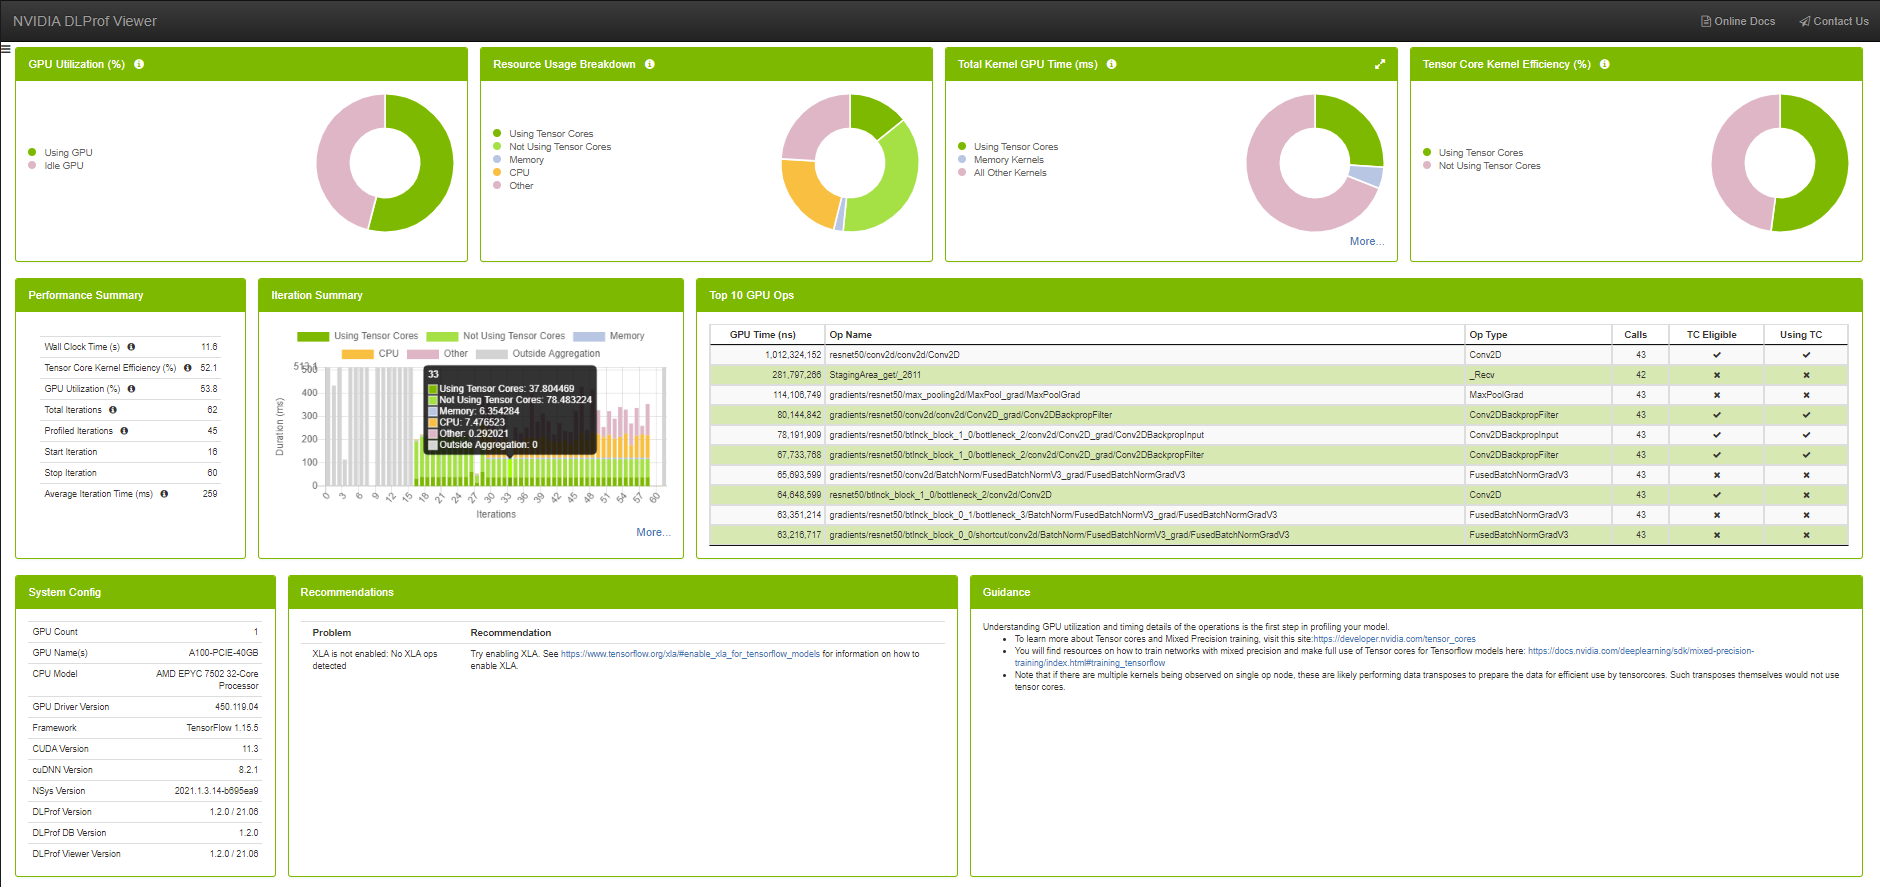
Visualization with DLProfviewer
The DLProf log files (dlprof_dldb.sqlite) must be loaded on your personal machine in order to be viewed in a local installation of DLProfviewer.
All the necessary information for usage and installation are available in the official documentation of Nvidia: DLProfviewer user guide
Important: It is necessary to align the DLProfViewer version to the level of the PyTorch version being used (see the documentation).
The visualization dashboard is displayed simply by opening the correct log file using the command:
dlprofviewer <dlprof_dldb>.sqlite
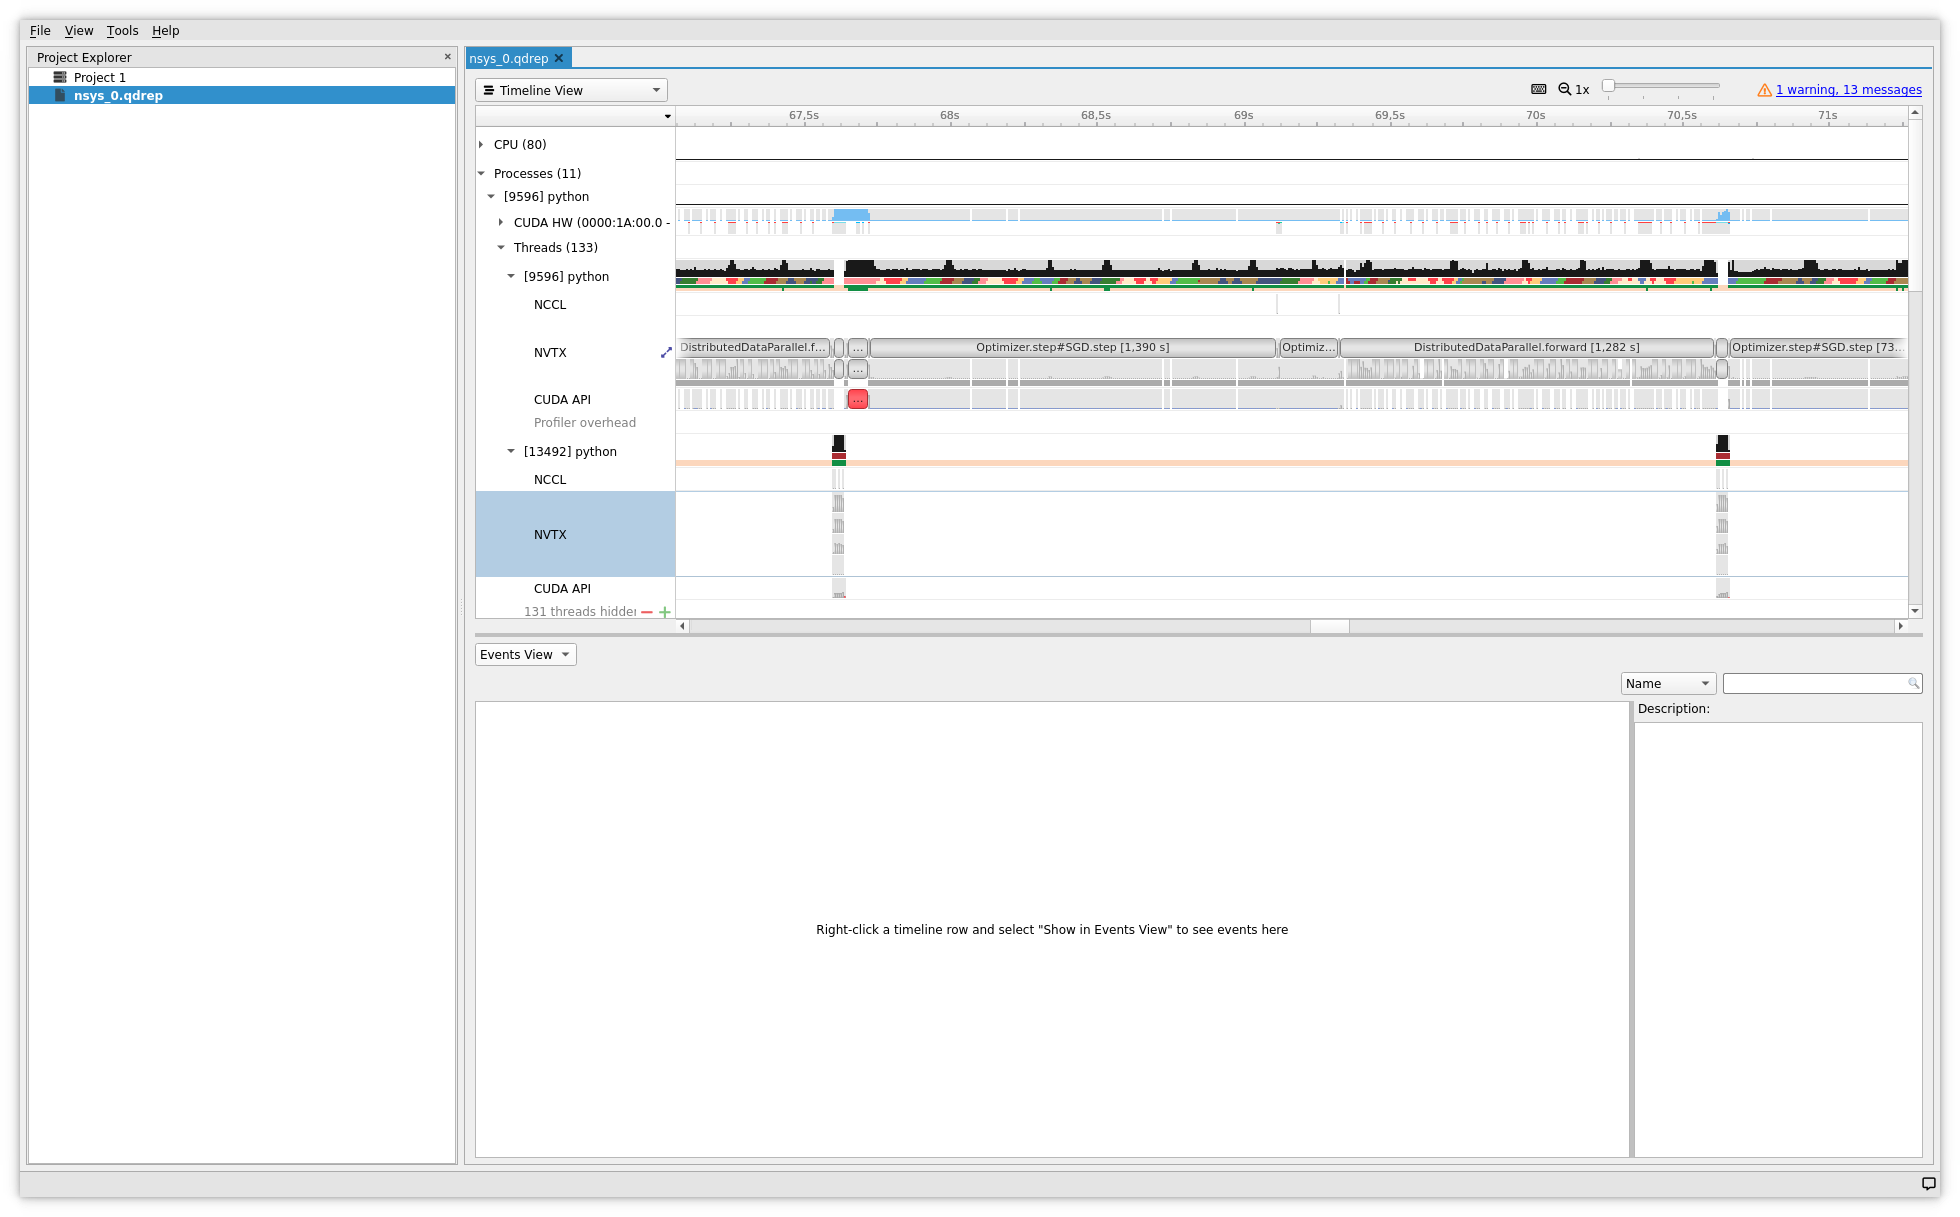
Visualization of the Timeline with Nsight
To view the chronological traces, it is necessary to open the Nsight reports generated by dlprof.
To do this you need to:
- Connect to Jean Zay with the graphical option (forwarding X11) :
ssh -X <login>@jean-zay.idris.fr
- Load a module which has the right version of Nsight Systems; for example:
module load nvidia-nsight-systems/2021.2.1
- Open the trace file with the graphical tool of Nsight; for example:
nsys-ui nsys_0.qdrep
Best usage of the profiler
Increase in computing time
In the case where the profiler drastically slows down the training, creates out of memories or other errors caused by overload of operations which it generates, it is advised to reduce the number of iterations (for example to 50, or even 10) by using the commands --iter_start and --iter_stop (see the dlprof documentation), or reduce the size of the dataset. The profiler is not designed to be launched during a complete training but rather, to optimize the usage of the machine before doing the real training.