

Table des matières
Jean Zay: TensorBoard visualisation tool for TensorFlow and PyTorch
Automatic learning algorithms are generally costly in computations. Therefore, it is important to determine the performance of your Machine Learning application. The TensorBoard graphical tool was created for this type of study.
The TensorBoard visualisation tool is available on Jean Zay via the IDRIS JupyterHub.
The way to access it is described in the dedicated documentation: Jean Zay JupyterHub Documentation | JupyterLab Usage | Jupyter interface | Applications.
Warning: to access TensorBoard, you need to be in an environment in which the tool has been installed:
- if you opened a JupyterLab instance, you will have to load beforehand a module (tensorflow, pytorch, …) containing TensorBoard as indicated in Jean Zay JupyterHub Documentation | JupyterLab Usage | Jupyter interface | Environment modules.
- if you directly opened a TensorBoard instance on a compute node (Spawn server on SLURM node + Frontend = Tensorboard), the tool is available without any further action from you.
TensorBoard functionalities
TensorBoard offers different visualisation tabs. The principal tools are:
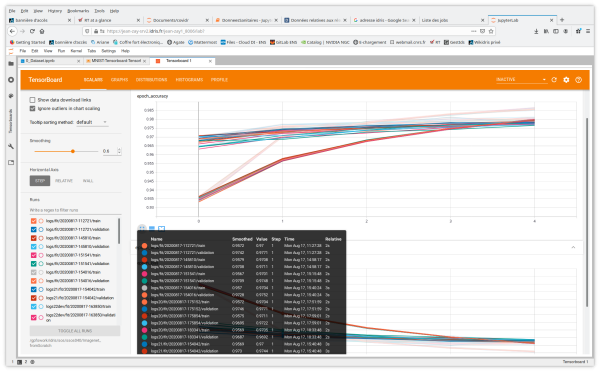
- Scalars shows how the loss and metrics change with each epoch by default. (It is possible to adapt it to track training speed, learning rate, and other scalar values.)
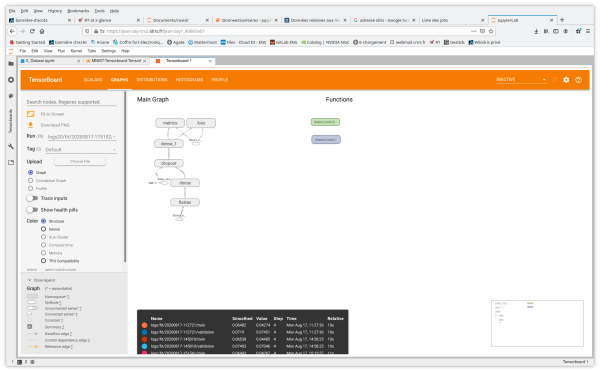
- Graphs helps you visualise the structure of your model.
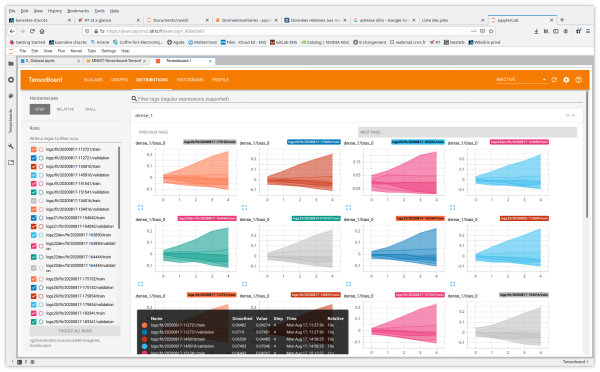
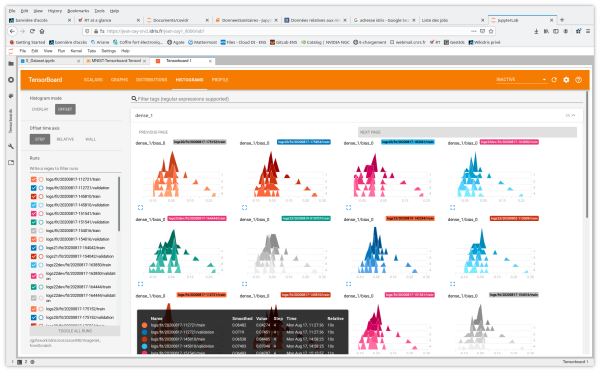
- Distributions and Histograms show the distribution of weights and biases at each epoch.
You also have access to the tabs and functionalities of Image Data, Hyperparameter Tuning, Embedding projector for Natural Language Processing applications, What If Tool and Debugger V2.
Training a model with TensorBoard callbacks
To benefit from the functionalities offered by TensorBoard, instrumentation of your code is necessary.
Instrumentation of your TensorFlow code
To generate TensorBoard logs in the suitable format for your TensorFlow application output, you must:
- Create a TensorBoard callback to capture the metrics. (
profile_batch = 0deactive the profiler)
# Create a TensorBoard callback
logs = "logs/" + datetime.now().strftime("%Y%m%d-%H%M%S")

tboard_callback = tf.keras.callbacks.TensorBoard(log_dir = logs,
                                                 histogram_freq = 1,
                                                 profile_batch = 0)
- Call it during the model training.
# Train model
model.fit(ds_train,
         epochs=2,
         validation_data=ds_test,
         callbacks = [tboard_callback])
Instrumentation of your PyTorch code
To generate TensorBoard logs for your PyTorch application output, you must:
- Define a
writer
from torch.utils.tensorboard import SummaryWriter
  # default `log_dir` is "runs" - we'll be more specific here
writer = SummaryWriter('runs/fashion_mnist_experiment_1')
- Insert the sequence of TensorBoard callbacks based on the results you want to visualise. For example:
# TensorBoard callback for Scalars visualisation
# here we report running loss value at each iteration i
writer.add_scalar('training loss',
                  running_loss / 1000,
                  epoch * len(trainloader) + i)
# TensorBoard callback for ImageData visualisation
writer.add_image('four_fashion_mnist_images', img_grid)
# TensorBoard callback for Graphs visualisation
writer.add_graph(net, images)
# TensorBoard callback for Embedding Projector visualisation
writer.add_embedding(features,
                    metadata=class_labels,
                    label_img=images.unsqueeze(1))
# TensorBoard callback for Weights/Bias histogramms
writer.add_histogram('distribution_weight', np.concatenate([j[1].detach().cpu().numpy().flatten()
                                                    for j in model.named_parameters()
                                                    if 'bn' not in j[0] and 'weight' in j[0]]), epoch + 1)
writer.add_histogram('distribution_bias', np.concatenate([j[1].detach().cpu().numpy().flatten()
                                                    for j in model.named_parameters()
                                                    if 'bn' not in j[0] and 'bias' in j[0]]), epoch + 1)
Official documentation
- Pytorch withTensorboard: https://pytorch.org/tutorials/intermediate/tensorboard_tutorial.html