

Table des matières
Jean Zay: TensorFlow Profiling with TensorBoard
The TensorFlow Profiler tools are integrated into TensorFlow.
The TensorFlow Profiler requires TensorFlow and TensorBoard versions which are superior or equal to 2.2. On Jean Zay, this profiler is available in TensorFlow versions 2.2.0 and above by loading the appropriate module. For example:
$ module load tensorflow-gpu/py3/2.2.0
Instrumenting a TensorFlow code for profiling
To generate TensorBoard logs in the appropriate format for the output of your TensorFlow application, it is necessary to:
- Create a TensorBoard callback to capture the metrics. Here, the profiling will be done between iterations 2 and 12:
# Create a TensorBoard callback
logs = "logs/" + datetime.now().strftime("%Y%m%d-%H%M%S")

tboard_callback = tf.keras.callbacks.TensorBoard(log_dir = logs,
                                                 histogram_freq = 1,
                                                 profile_batch = (2,12))
- Call it during the training of the model:
# Train model
model.fit(ds_train,
         epochs=2,
         validation_data=ds_test,
         callbacks = [tboard_callback])
Visualization of a TensorFlow code profile
Visualization of the results of the TensorFlow Profiler is possible via TensorBoard in the PROFILE tab. Accessing TensorBoard on Jean Zay is documented here. You can also visualize your logs by loading them onto your local machine.
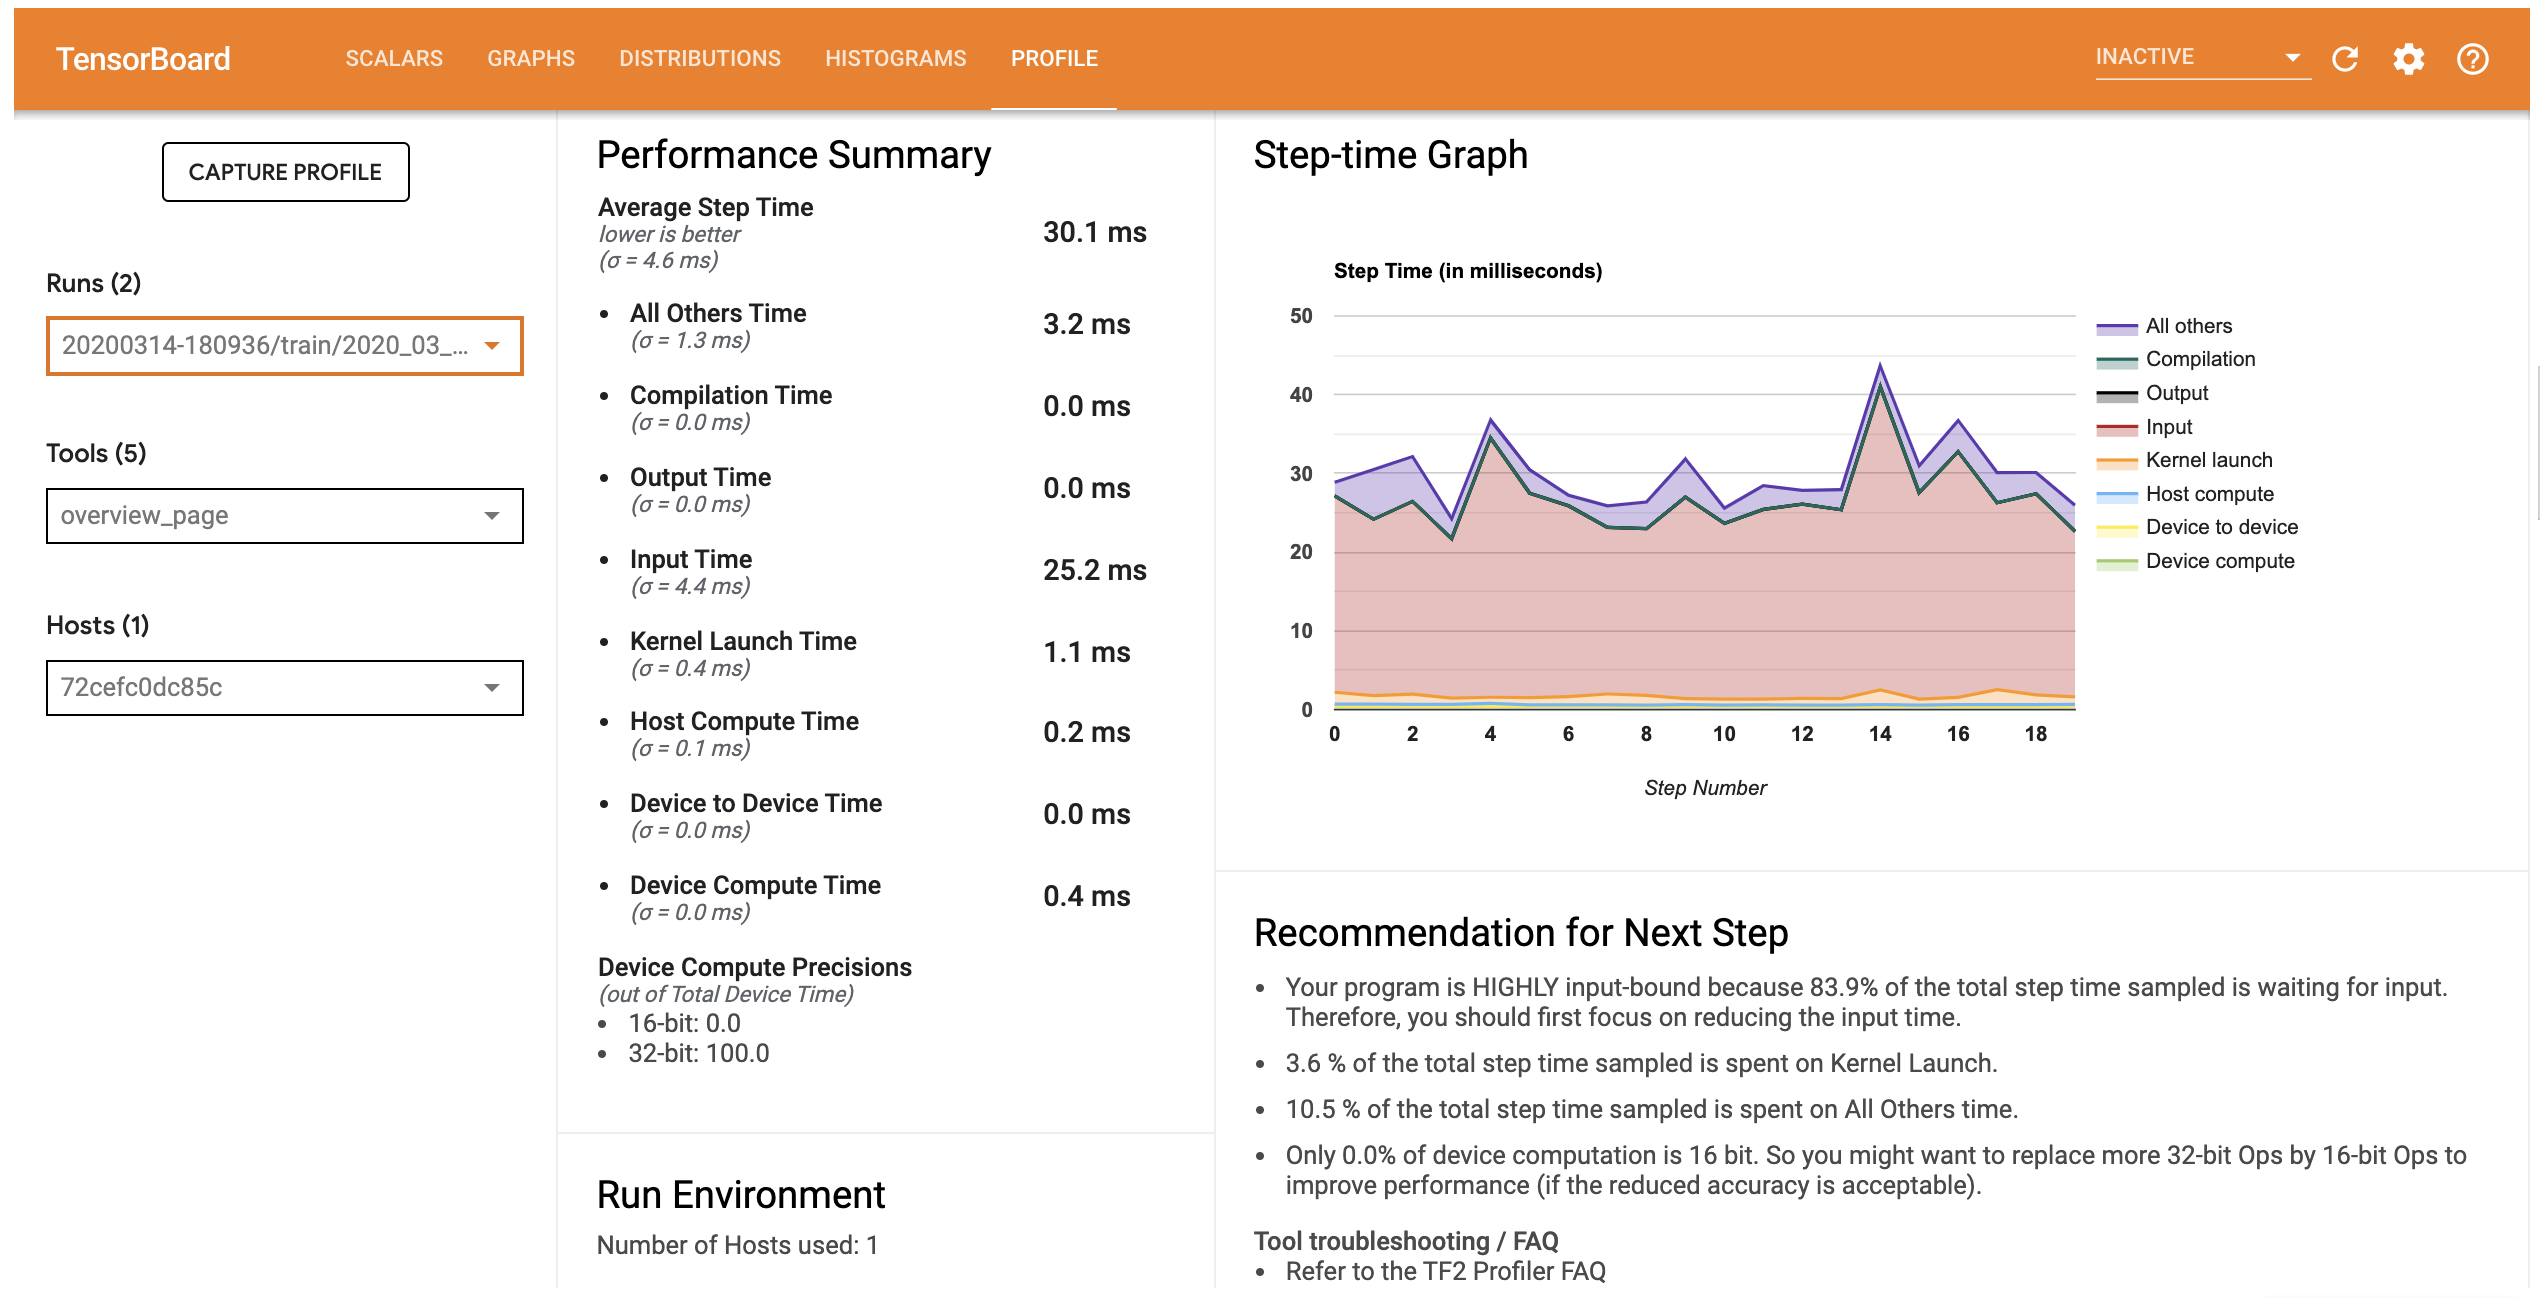
The TensorBoard PROFILE tab opens onto the Overview page. Here you will find a summary of the execution time performance of the different computing steps. This allows you to quickly see what consumes the most execution time: the learning, data loading or data pre-processing.
The Trace Viewer page provides a more detailed view of the execution sequence by distinguishing between the operations executed on GPUs and on CPUs. For example:
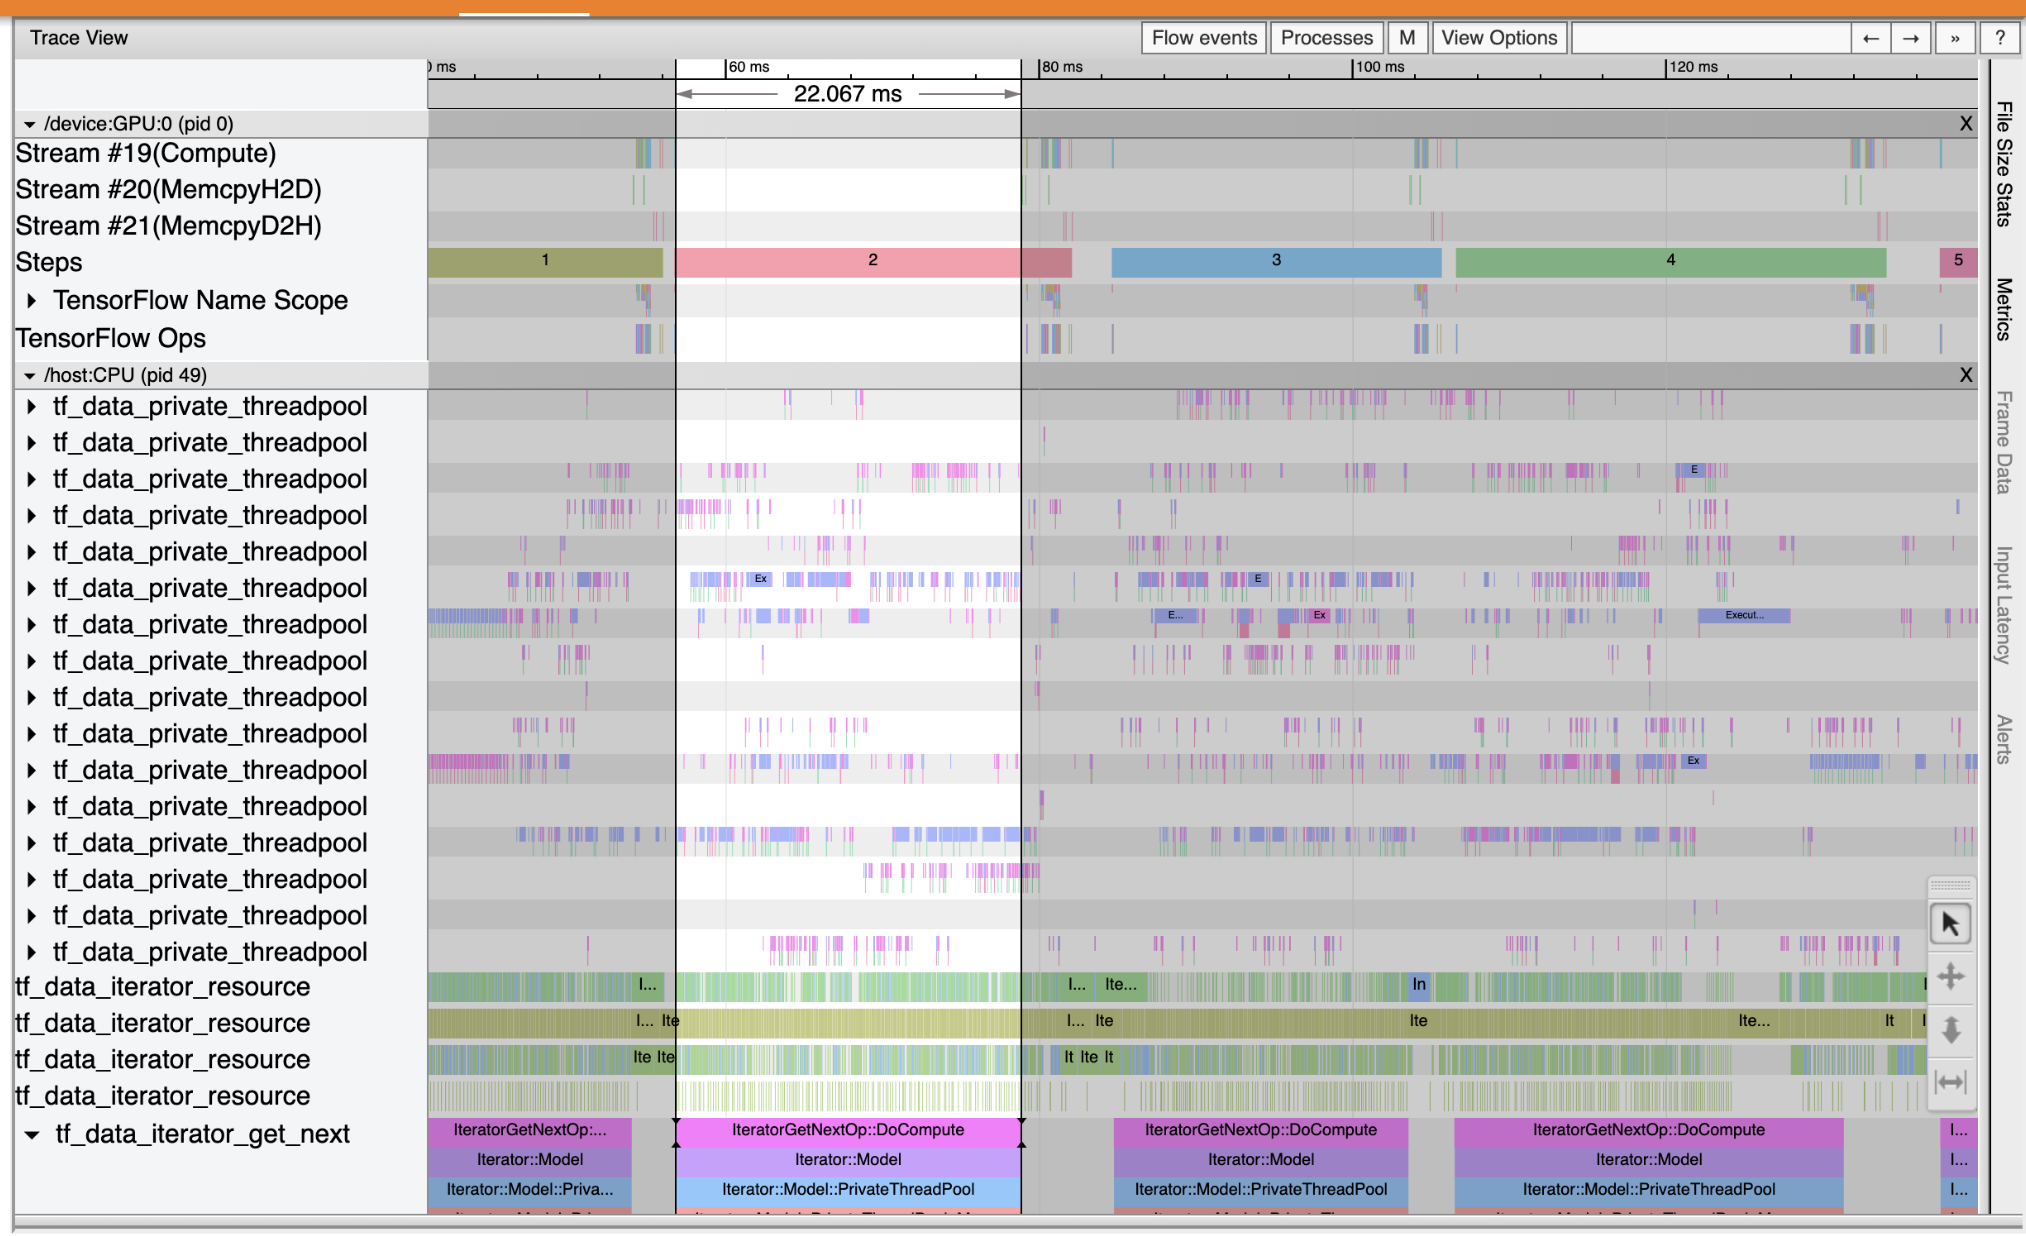
In this example, we see that the GPU (in the top part) is used very little most of the time compared to the CPU (in the bottom part). The blocks of colour show that the GPU is only used at the end of the steps whereas the CPU is used regularly on certain threads. An optimization is certainly possible by better distributing the work between GPUs and CPUs.
Official documentation
- Profiling on Tensorboard with Tensorflow: https://www.tensorflow.org/tensorboard/tensorboard_profiling_keras